Resource Depletion, Climate Change, and Economic Growth

Andrew Steer
Abstract
Current patterns of energy and natural resource use, agricultural practices, and urbanization appear to be largely unsustainable and require urgent remediation. Left unchecked, these patterns will lead to dangerous climate change and reduced economic growth, as a result of increased economic, social, and environmental costs and decreased productivity. Current economic models fail to incorporate the effects of high-carbon growth on climate change and environmental degradation. A new generation of economic models is needed that account for the risk of catastrophic impacts, do not overestimate the costs of climate change action, and use a discount rate that does not treat future generations as less important than the current one. Models of how economies adjust to tighter environmental policies need to incorporate new evidence that actions such as increasing energy and resource efficiency can lead to larger win-win gains than were earlier thought possible; that smart policies combining carbon pricing and directed investment in research can lead to increased investment, growth, and competitiveness; and that investment can be raised by providing long-term policy confidence about the price of carbon and associated risks of stranded assets. A variety of policies—including removing subsidies on fossil fuels, pricing carbon, addressing other market failures, improving international cooperation, and facilitating citizen voice through the marketplace—will play an important role in putting economic processes on a more sustainable footing.
Keywords:
Carbon pricing, climate change, environmental degradation, food prices, green growth, greenhouse gas emissions, international cooperation, natural resource depletion, population growth
WORKING PAPER 5
JUNE 2013
Global Citizen Foundation
Phone: +41 (0) 225 18 0265
e-mail: info@gcf.ch
Resource Depletion, Climate Change, and Economic Growth
Andrew Steer
Natural resources are an essential input in the production process. This is true for marketed resources (such as metals, minerals, and land) and nonmarket resources (such as clean air, weather, and myriad ecosystem services). Over the past century, as the global population quadrupled and economic production increased about 20-fold, demand for natural resources rose greatly. The extraction of construction materials grew by a factor of 34, ores and minerals by a factor of 27 (UNEP 2011a). The human footprint on the natural world is now vastly greater than ever before. In a real sense, we have moved from a relatively empty world to a full one. For the first time, the scale of the human footprint has grown to the extent that human economic activity has the power to influence major planetary systems, prompting some scientists to note that we may be moving into a new epoch, from Holocene to “Anthropocene.”
It is now four decades since the Club of Rome’s famous report Limits to Growth. The economics profession was generally critical at the time, noting the report’s massive underestimation of the power of price effects, substitution, and new technology. Although economists appeared vindicated, at least then, a growing number in the profession are now questioning whether there are indeed limits to growth.
In assessing the two-way relationship between economic growth and the natural world, it is important to distinguish marketed resources, for which price signals prompt substitution, from nonmarketed resources. Many resources—forests, soils, and water quality, for example—have elements that lie within the market system and elements that lie outside it. Forests, for example, provide marketed resources, such as timber, as well as an array of nonmarketed services, such as climate regulation, soil creation, and erosion control. It is also necessary to distinguish externalities that are primarily local or national from those that are global. Currently, it is global problems that pose the greatest threat. But fresh questions are also being raised about whether the pace of growth in the demand for marketed natural resources is now so rapid that technologies for substitution will not emerge quickly enough, causing rising commodity prices and supply interruptions to limit further economic growth, jeopardizing development aspirations.
Andrew Steer is President and CEO of the World Resources Institute. He is grateful to Nicholas Bianco and Aaron Holdway (both research associates at the World Resources Institute) for research support and to Franklin Allen, Jere Behrman, Nancy Birdsall, Shahrokh Fardoust, Jennifer Morgan, Jeremy Oppenheim, Theophilos Priovolos, Janet Ranganathan, Dani Rodrik, and Arvind Subramanian for valuable comments. This paper was prepared for the Towards a Better Global Economy Project funded by the Global Citizen Foundation. The author alone is responsible for its content. Comments or questions should be directed to Andrew.Steer@wri.org.
In this paper, the term resource depletion is used to refer to all natural resources, marketed and non-marketed, and those in between. The place of climate change in resource depletion may not be intuitive to some, as the upper atmosphere may not appear as a natural resource of relevance to the production system. In fact, the atmosphere, and the climate it influences, is among the most valuable of all natural resources. Because climate change is the greatest and most complex problem to solve, this paper primarily focuses on it. Further, if climate change can be successfully addressed, other resource problems will be easier to solve, providing another reason for this focus.
This paper seeks to shed light on the following questions:
- Are current patterns of growth sustainable throughout the 21st century?
- Are alternative paths available with today’s technology and expected nonbreakthrough progress that will allow healthy rates of growth into the indefinite future? Are there automatic tendencies to move an economy from current paths to greener paths as problems become ever more evident?
- Does new understanding of “green growth” offer new opportunities for spurring economic growth as well as improving the quality of life?
- What are the implications of the above for policy at the national and international levels, particularly for climate change?
1. Are Current Patterns of Growth Sustainable?
Evidence suggests that current patterns of energy and resource use, agricultural practices, and urbanization will lead to increased costs and decreased productivity that will reduce growth, as conventionally measured, with sharp unpredictable threshold effects likely. The impact will be felt differentially across countries. Environmental damage already imposes a deadweight loss to the economy approaching 10 percent of gross domestic product (GDP) in many emerging economies —even before adding likely impacts from climate change (World Bank 2012a). Moreover, the costs of resource depletion will not be borne equally. The bottom half of the income distribution—both across and within countries—will suffer most from the direct effects, which will include higher prices of food, fuel, and fiber and lower rates of growth and job creation.
1.1 Impacts of Resource Depletion Today
The pace and scale of environmental damage has been well documented. More than one quarter of the world’s land surface has been degraded as a result of soil erosion, salinization, nutrient depletion, and desertification (Bai and others 2008). Water withdrawals tripled in the past 50 years, leading to water scarcity and groundwater depletion. In developing countries, withdrawals are projected to increase by another 50 percent by 2030, by which time more than 5 billion people—two-thirds of the world’s people—could be living in areas facing moderate to severe water stress (WRI forthcoming).
Growth has also strained ecosystems. Roughly 60 percent of the world’s ecosystem services are now of lower quality than they were 50 years ago (Millennium Ecosystem Assessment 2005), the current rate of species extinction is 100–1,000 times higher than in prehuman days (IUCN 2004), and all of the planet’s 13 hottest years on record have occurred since 1997 (WMO 2013).1
1 The year 2012 broke yet more records. It was the 36th consecutive year in which global temperatures were above the average for the previous century and the hottest year in U.S. history (DeConcini and Thompson 2013).
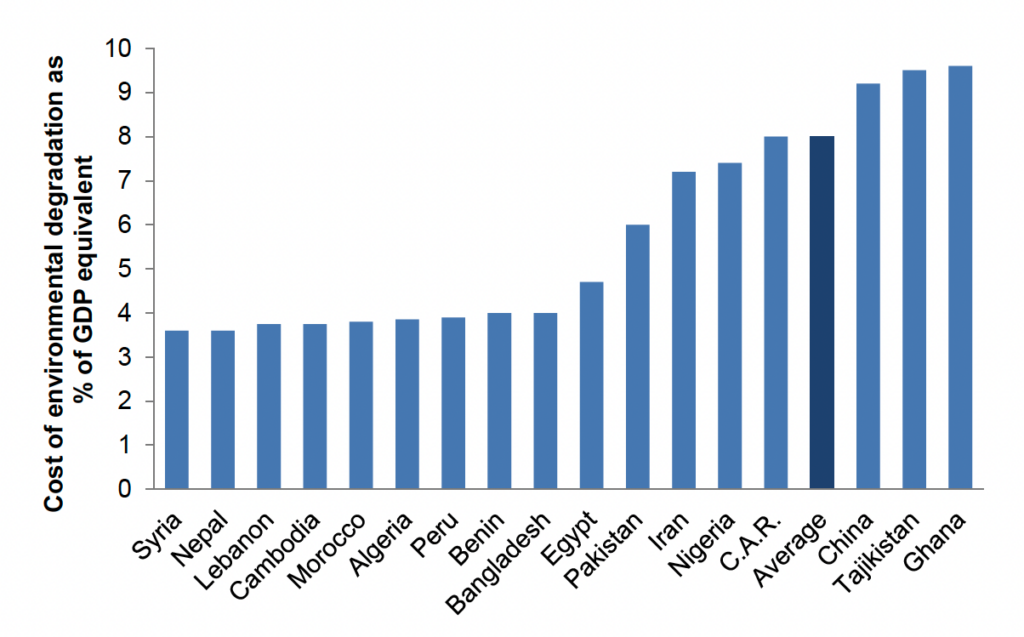
The economic cost of such damage is significant. In China, for example, air pollution alone is estimated to cost the equivalent of 3.8 percent of GDP a year (Cropper 2010). Figure 1.1 summarizes the estimated costs of environmental damage across a range of countries. The bulk of these costs come from pollution and the associated health and productivity costs. Such estimates generally do not place monetary values on more complex issues, such as the loss of biodiversity or the degradation of ecosystem services. They are also generally based only on current costs, ignoring future and less certain costs, such as the costs of climate change.
Figure 1.1 Annual Cost of Environmental Damage in Selected Countries
Evidence is growing that the human cost of environmental damage is very high. Some estimates suggest that carbon-intensive growth is already responsible for about 5 million deaths a year—400,000 as a result of hunger and communicable diseases exacerbated by climate change and 4.5 million as a result of associated air pollution (DARA and the Climate Forum 2012).
The costs of environmental damage can have major impacts on economic production. They include, for example, the impacts on agriculture from the rise in temperature and the increase in the frequency and severity of extreme weather events (not necessarily caused by climate change but made much more likely by it). For example, the drought in the United States that began in 2012 is expected to cost 1 percent of GDP; it may be the most costly natural disaster in U.S. history. The combination of adverse climate and rapidly growing demand has led to sharply higher food prices over the past few years. The spike in food prices in the second half of 2010 alone was estimated to have driven more than 40 million people into poverty.2
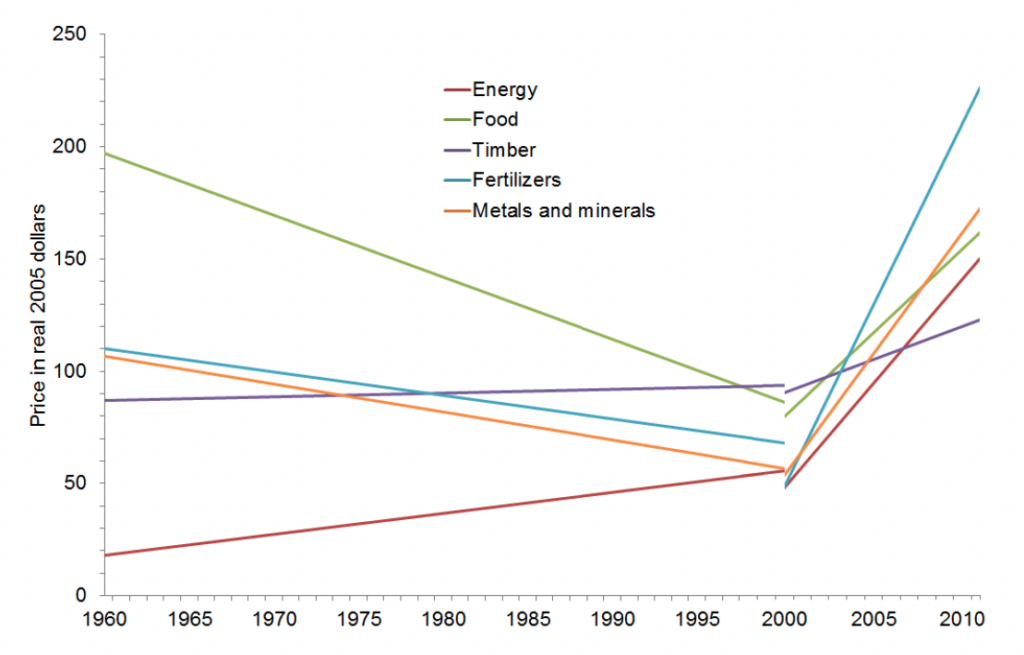
Figure 1.2 World Prices of Selected Commodities, 1960–2010: From Abundance to Scarcity?
2 Some recent analysis suggests greater resilience on the part of the poor, with a smaller overall impact (IFPRI 2013)
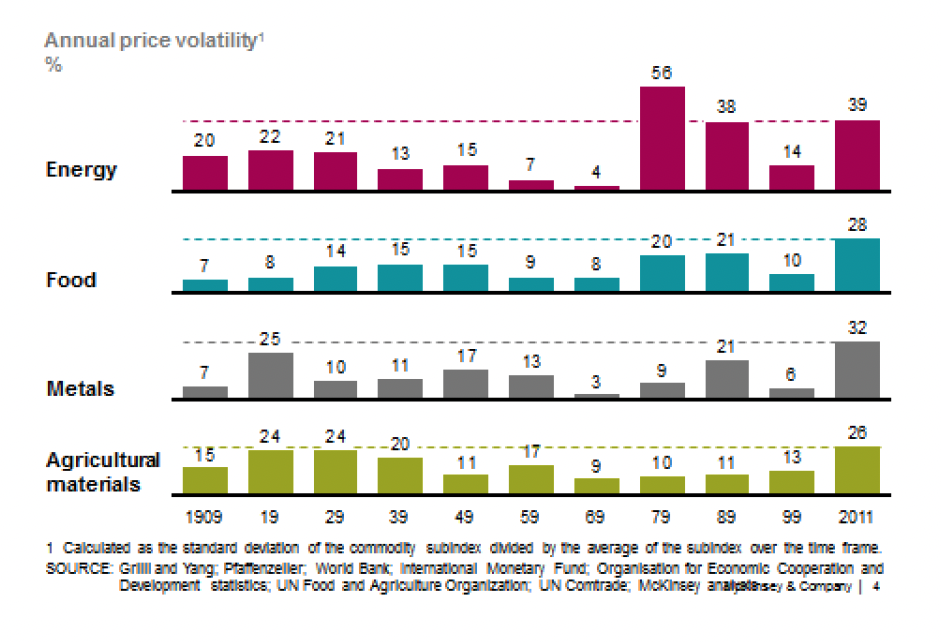
The rise in food prices mirrors a more general trend in commodity prices. The past century saw a broad decline in overall commodity prices (except for energy)—an astonishing fact given that real incomes and consumption rose by a factor of 20. But such gains were fully reversed during the first decade of the current century (figure 1.2). It is too early to say whether this change represents a permanent upward shift, but a growing number of analysts are concluding that it does. Prices are not only higher, they are also more variable (figure 1.3) and more highly correlated with one another than at any time over the past century (McKinsey 2011).
Figure 1.3 Volatility of Resource Prices, 1909–2011
1.2 Measuring Sustainability
Whether current patterns of economic activity are “sustainable” depends on the extent to which depletion of natural forms of capital can be (and is) compensated by the accumulation of other forms of capital, especially human and fabricated capital.3 Efforts have been made to assess such sustainability, albeit with a limited array of natural assets. Arrow and others (2010) analyze this question for the United States and China. They find that in both countries, the accumulation of (especially human) capital has more than compensated for high levels of resource depletion. Given the massive scale of resource depletion and environmental damage in China, this finding may seem surprising. But given its rate of investment, and the limited range of environmental assets included in the analysis (basically extractive resources, forests, and soils), the results are to be expected. The authors recognize the limitations of such analysis. Estimates address a limited range of natural assets, assume a high (and probably unrealistic) degree of substitutability among different forms of capital, and do not include, in any real depth, uncertainty or the risk of threshold effects or catastrophic irreversible change.4
Led by the World Bank, researchers have tried to measure national capital stocks, including manmade, human, and natural stocks, in order to assess the extent to which the inclusion of natural capital affects the direction and pace of change of the overall productive capacity of the economy, and hence its prospects for sustained rising consumption and welfare levels. The importance of natural capital—narrowly defined to include metals, minerals, soils, and forests—is much greater in lower-income countries than in richer countries, accounting for an estimated 30 percent of total wealth in low-income countries but only 2 percent in high-income countries (table 1.1).
3 The “Hartwick rule” (Hartwick 1977; Solow 1986) provides a rule of thumb for resource-dependent economies. It shows that if the rents from nonrenewable resources are invested rather than consumed, consumption over time can be sustained. For an overview of the sustainability of growth, see Heal (2010).
4 See, for example, Hamilton (2010), who provides a theoretical framework for sustainability using the concept of “genuine savings.” He points out that estimates of sustainability are based on assumptions about the future that may turn out to be too optimistic.
Table 1.1 Distribution of per Capita Wealth by Type of Capital and Country Income Level, 2005
(percent, except where otherwise indicated)
| Country income level | Total per capita wealth ($) | Produced capital | Intangible capitala | Natural capital |
| Low | 6,138 | 13 | 57 | 30 |
| Lower-middle | 16,903 | 24 | 51 | 25 |
| Upper-middle | 81,903 | 16 | 69 | 15 |
| High-income | 588,315 | 17 | 81 | 2 |
| Total | 120,475 | 18 | 77 | 5 |
a. Intangible capital comprises human and institutional capital.
This difference helps explain why poor countries are more vulnerable to resource depletion than richer countries, and why the sustainability stakes may be even higher for developing countries than industrial countries.5 Compensation for the depletion of natural capital by increases in other forms of capital is likely to be easier where the share of natural capital is smaller. Particularly striking from table 1.1 is the importance of “intangible” capital (encompassing human and institutional capital), which accounts for more than 80 percent of total wealth in rich countries. The importance of intangible capital suggests how important it is that developing countries reinvest income from natural resources into these assets. It also perhaps warns against assumptions of high substitutability between natural and intangible assets.6
One approach to assessing the sustainability of countries’ development paths is to measure the rate of “genuine savings” by adjusting the rate of savings to take account of resource depletion (and the accumulation of human capital). For low-income countries, especially those dependent on natural resource exploitation, the picture is not encouraging. Calculations show that genuine savings in Sub-Saharan Africa became negative in 2004 and remained highly negative throughout the decade, implying that consumption levels were not sustainable (World Bank 2011a).
5 These estimates are narrow; taking the impacts of climate change into account, for example, would change this weighting. Indeed, including the monetized value of a stable climate as a productive asset would change these percentages substantially.
6 The “Hartwick Rule” (Hartwick 1977; Solow 1986) provides a simple rule of thumb for sustainable development in countries that depend on nonrenewable natural resources. It holds that consumption can be maintained—the definition of sustainable development—if the rents from nonrenewable resources are continuously invested rather than used for consumption. Many resource-rich developing countries do not reinvest the rents.
About 30 countries have now institutionalized such “natural wealth” accounting, although most of them focus almost exclusively on the depletion of mineral and energy assets rather than on a more complete set of resources, including forests, clean water and air, and ecosystem services. In 2013, at the Rio+20 UN Summit, more than 50 countries and 85 major institutions signed on to a Natural Capital Declaration, committing to revising their accounts to incorporate nature. This commitment builds on a growing call for revisions in the way nations and corporations report their assets and income (Stiglitz, Sen, and Fitoussi 2009).7
1.3 Impacts of Natural Resource Depletion in the Future
A number of drivers suggest that the impacts of natural resource depletion will accelerate in the future, especially for resources outside or only partially within the marketplace, such as water, soil, ecosystem services, and climate. An increase in the world population by more than 2 billion people between 2010 and 2050 will place additional pressures on natural resources. The impacts will be magnified because the increased population will be located primarily in cities, often in low-lying areas vulnerable to storm surges, and in vulnerable agricultural areas (see the paper by Behrman and Kohler on this website).
Although environmental stresses brought about by population growth are significant, of even greater impact will be rising incomes. During the two decades since 1990, the size of the global middle class rose from 1 billion to 2 billion (as defined by the OECD as having purchasing power parity per capita income of $3,000–$15,000). In the coming two decades, it is probable that another 3 billion will join the middle class (OECD 2011; McKinsey 2011).8 This transition—in which the majority of the world will be able to afford a private motor vehicle,9 modern appliances, and a diet that includes meat daily—represents an important threshold in human pressure on the natural world.
7 Efforts to incorporate environmental assets and liabilities in financial statements of companies are gaining momentum. In 2011, Puma became the first company to seek to fully value its environmental impacts in its financial statements. Other major companies are following.
6 The “Hartwick Rule” (Hartwick 1977; Solow 1986) provides a simple rule of thumb for sustainable development in countries that depend on nonrenewable natural resources. It holds that consumption can be maintained—the definition of sustainable development—if the rents from nonrenewable resources are continuously invested rather than used for consumption. Many resource-rich developing countries do not reinvest the rents.
2. The Unique Challenge of Climate Change
Climate change is among the greatest and most difficult challenge facing the world today. A number of characteristics—its global nature, its intergenerational impact, the uncertainty and massive downside risks associated with it—combine to make it an unparalleled challenge of global collective action.
Climate change is also highly significant in that successfully addressing it will go a very long way toward addressing other environmental problems. Dealing with the problems of air pollution; water risks; the loss of forest, natural habitats, and biodiversity; and soil degradation will benefit greatly from actions to address climate change. These spillover effects provide another reason for focusing attention on climate.
The atmospheric concentration of carbon dioxide (CO2) rose from about 285 parts per million (ppm) in the preindustrial era to 400 ppm today.10 To have a 50 percent chance of limiting average temperature rise to 2°C above preindustrial levels (the target maximum increase negotiated under the United Nations Framework Convention on Climate Change), atmospheric CO2 concentrations need to remain below 450 ppm. Achieving this goal is a receding possibility; meeting it would require global greenhouse gas emissions to peak by 2020 and then fall to 50 percent of today’s levels by 2050 (including an 80–90 percent reduction from current levels in industrial countries). Current trends suggest that concentrations could reach 700 ppm by the end of this century, implying a mean temperature increase of about 5°C. Such temperatures have not occurred for 30 million years.
8 Nearly 90 percent of this increase is projected in the Asia Pacific region. The OECD projects that global per capita average incomes will rise 4.7 percent a year during the period. See Kharas (2010) for a review of the emerging middle class in the developing world.
9 Most projections suggest a motor vehicle fleet of almost 2 billion by 2030, up from 800 million in 2010 (Dargay, Gately, and Sommer 2007).
10 Concentrations of greenhouse gas emissions controlled under the Kyoto Protocol were measured at 444 ppm CO2e in 2010. If all greenhouse gas emissions are measured, including aerosols, which have a cooling property, the figure is about 400 ppm CO2e (European Environment Agency 2013).
The impact of climate change on economic activity has been studied for the past two decades (Tol 2009). Estimates of impact vary greatly, depending on the assumptions made about the scale of warming, the pathways through which the impact takes place, and the costs of adaptation.
Climate change can affect economic activity through four principal paths:
- increases in temperature and the associated impacts on agriculture, energy demand, disease, and so forth
- rises in sea level and the associated threat to infrastructure and production capacity, especially in urban areas
- increased intensity of extreme weather events and the associated destruction of infrastructure and agriculture
- shifts in the hydrological cycle and the associated impacts on agriculture, power and industrial systems, and drinking water.
The most complete models seek to account of all of these channels. Few modeling efforts claim to do a thorough job on all four, however, and fewer still address the kinds of multiplicative interactions described below.
The Stern Report (Stern 2006), which remains the iconic statement on the costs of climate change, reached the following conclusion:
Using the results from formal economic models, the Review estimates that if we don’t act, the overall costs and risks of climate change will be equivalent to losing at least 5 percent of global GDP each year, now and forever. If a wider range of risks and impacts is taken into account, the estimates of damage could rise to 20 percent of GDP or more. In contrast, the costs of action—reducing greenhouse gas emissions to avoid the worst impacts of climate change—can be limited to about 1 percent of global GDP each year.
All researchers estimating the impacts of climate change would acknowledge that uncertainties exist from many sources, including the impact of atmospheric carbon intensity on climate (including the possibility of discontinuities), the impacts of climate change on production processes, and the technological ability of production processes to adapt to such impacts. Although there is great variance around the mean, most researchers would probably agree with the following statements, however:
- It will be difficult to limit the average increase in global temperature to 2°C above preindustrial levels, as the countries of the world agreed to do at Cancun in 2010. Global greenhouse gas emissions would need to peak by about 2020 to have a good chance of achieving this goal. Given that no global agreement will be in effect this decade, this is unlikely. Instead, an average temperature increase of 2°C –5°C should be assumed to be the most likely estimate during this century.
- The first-round economic impact of climate change mitigation, estimated in terms of costs as a share of GDP, varies greatly, from 1 percent to 10 percent for a 3°C increase in warming and up to 20 percent for a 5°C increase. The estimates are substantial in absolute terms but relatively modest compared with the projected growth of the global economy. They are also large compared with the cost of addressing the impacts of climate change.
- Costs vary greatly by geography, with benefits in some high-latitude countries and much higher costs closer to the Equator. Tropical countries, which tend to have higher rates of poverty, will generally be more affected than cold climate countries. For a 2°C warming scenario, it is estimated that about 75–80 percent of the impact would fall on developing countries.11
- The probabilities of estimates being wrong are highly asymmetrical, especially when larger temperature increases are assumed. Discontinuities triggered by ice melt, tropical forest dieback, ocean acidification, and other events would all multiply the impacts substantially.
11 Some researchers have sought to identify direct relationships between temperature and income levels. Dell, Jones, and Olken (2009) estimate that a 1°C increase in a given year reduced economic growth that year by about 1.1 percentage points in poor countries while having no discernible effect on growth in rich countries.
There is a growing sense that current modeling techniques do not do justice to the seriousness of the problem, for two reasons. First, they fail to take into account the interaction of risks, which can multiply the drag on growth and the quality of life. Second, as temperature increases rise above 2°C, the smooth-line assumptions of most models are no longer tenable.
2.1 Risk Interaction and Multiplication
Interaction among the various stressors makes the future highly uncertain and highly risky. Consider, for example, water and its links to food production and energy supply, shortages of which pose serious threats to food and energy security in the decades ahead:
- Global water models suggest a sharp increase in water-related risks over the coming decades, as demand for water doubles. Water will become scarcer in some areas (with scarcity likely to increase where there is already a shortfall), and floods and droughts will become both more extreme and less predictable. Figure 2.1 presents the best current scientific estimates of the changing risk of water scarcity based on the World Resource Institute’s Aqueduct model, a major tool for mapping water risk. A recent corporate survey found that more than 50 percent of Global 500 respondents report that water risks are already adversely affecting their profitability.
- Food production will need to increase by nearly 70 percent by 2050, implying broadly the same rate of production growth as in the past 40 years, when Green Revolution technologies and the massive expansion of irrigated and rain-fed crop land fueled growth. Agriculture already accounts for 70 percent of all freshwater withdrawals from rivers, lakes, and aquifers; achieving the required additional growth will demand vast amounts of additional water. This increased demand is likely to coincide with a shrinkage in availability, even for existing irrigated areas in Asia, and much more variable rainfall in much of Africa, all at a time when rising temperatures will reduce yields in the tropics and subtropics. A rough rule of thumb suggests that absent adaptive strategies, every 1°C in temperature rise will reduce productivity by 10 percent. Figure 2.2 shows the current best understanding of the impacts of climate change on agricultural yields of a 3°C average increase in global temperature (now rapidly becoming a central estimate). To add to the challenge, agriculture currently accounts for about 24 percent of global greenhouse gas emissions (from methane emissions from livestock and rice paddies and nitrous oxide emissions from fertilizers, soil erosion, and agriculture-induced changes in land use). These emissions will need to be reduced dramatically if climate change is to be addressed.
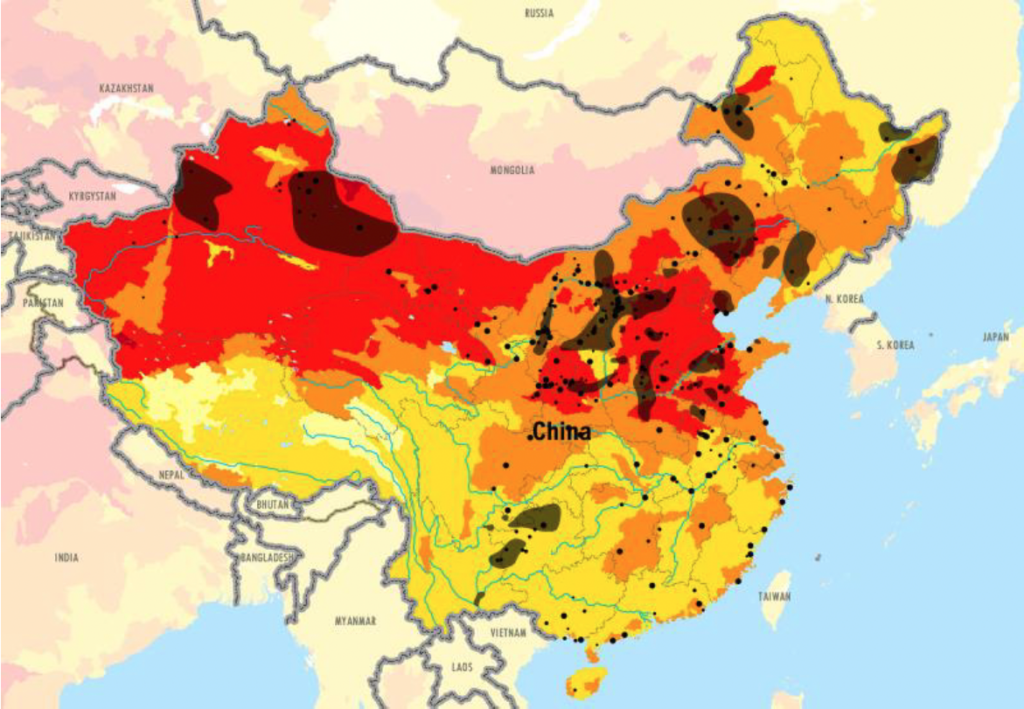
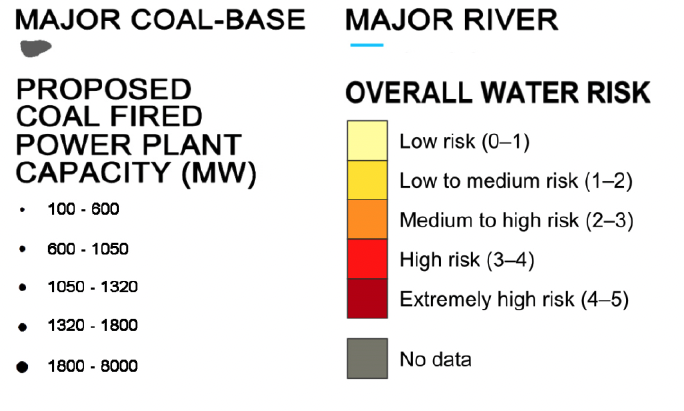
- Primary energy demand will rise by an estimated one-third over the next 20 years, with growth especially high in Asia and Africa. Energy security is increasingly dependent on plentiful and reliable water supplies. Hydropower is already vulnerable in many parts of the world. The development of shale gas and coal-powered generation is highly dependent on water supplies. For a country like China, which will account for 40 percent of all new planned generation from coal in the coming years (figure 2.3) and which faces increasingly severe water shortages, such dependence poses a serious threat to economic security. Current models fail to capture the scale of such risks. Figure 2.4 plots the location of China’s coal reserves and planned coal-fired power plants (which depend on large qualities of reliable water) and overlays them with risks of water shortages, illustrating the link between climate change and water and energy security.
Figure 2.1 Projected Global Changes in Water Scarcity between 2000 and 2025
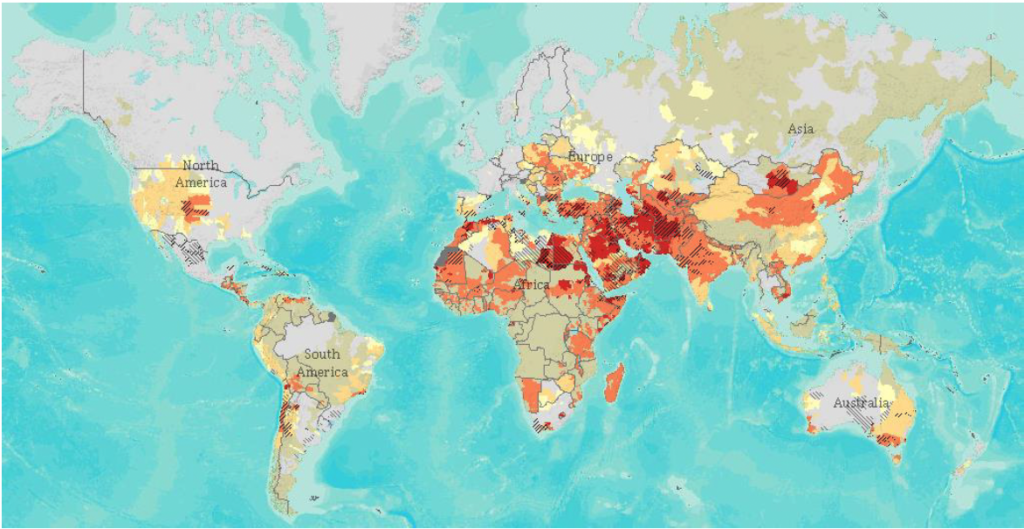

Note: Water risks are calculated using water modeling for major aquifers, based on detailed data on rainfall patterns, consumption, reuse, and groundwater. Projections draw on the middle-of-the-road (scenario A1B) climate projections by the Intergovernmental Panel on Climate Change and assumptions of population and economic growth. Updated baseline water stress projections maps, using data from the IPCC Fifth Assessment Report, will be available in early 2014.
Figure 2.2 Projected Impact of Climate Change on Agricultural Yields in 2050
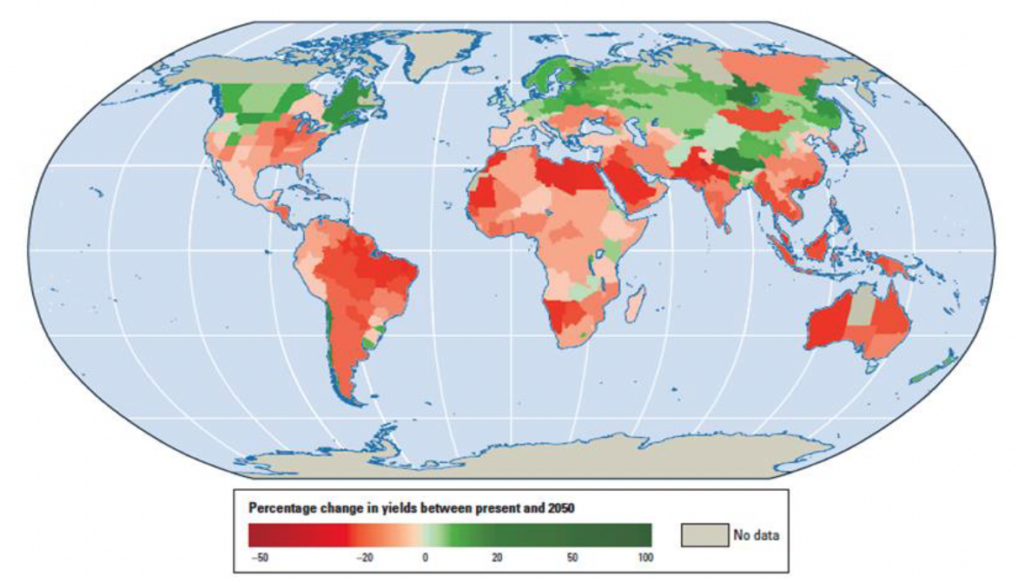
Figure 2.3 Planned New Coal-Fired Power Plant Capacity in the World
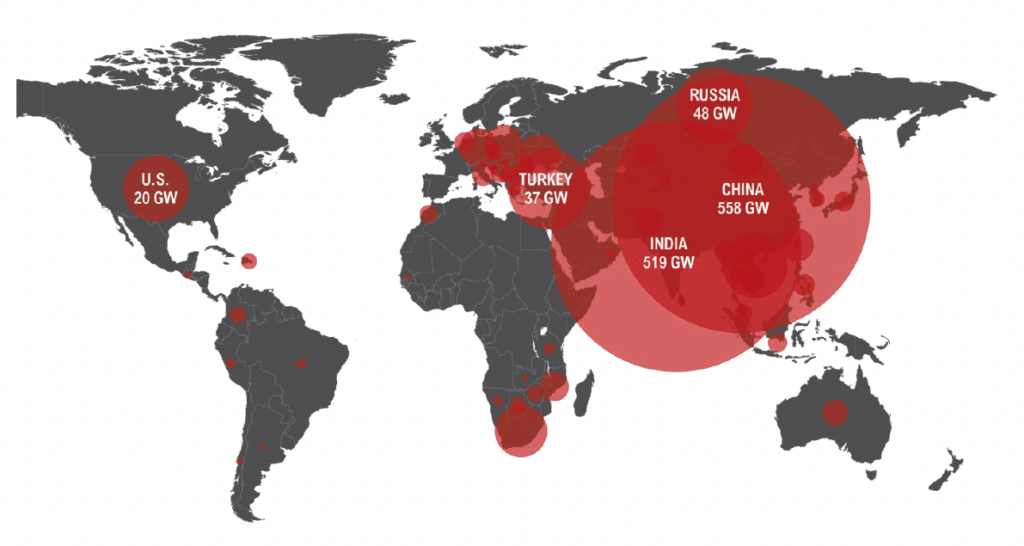
Note: Figure incorporates 1,200 new plants currently proposed.
Figure 2.4 Coal Reserves and Planned Coal Power Plants Coming Face to Face with Water Stress in China
2.2 Threshold Effects
There is growing recognition that both physical and economic models have seriously underestimated the risks of climate change. Inability to model critical tipping points, such as major ice melting (leading to sharp increases in sea level) or permafrost melting (leading to massive leakage of methane and a sharp acceleration of climate change), has meant that these impacts have implicitly been zero when translated into economic models. This failure was less important when it appeared that increases in temperatures might be kept to a maximum of 2°C. Now that realistic expectations are for a 3°C–5°C increase, such omissions may prove fatal in encouraging complacency in policy making.
To illustrate this point, when global average temperatures were last 3°C warmer than today (3–5 million years ago), sea levels were 20 meters higher than they are today (Miller and others 2012). Such an increase would take several centuries to occur, but once started it would be irreversible. Such potential impacts are almost totally lacking from current models. Even absent any ice melting, current best estimates suggest an increase in sea level of 1–2 meters during the current century. When combined with increased storm surges, this increase may require relocating hundreds of millions of people, with the biggest impact on the poor (Nichols and others 2011).
Such tipping points may apply not only to sea level rise but also to shifts in the hydrological cycle. Whether through shifts in the monsoon pattern in Asia or self-reinforcing forest dieback in the Amazon, impacts on food production and other ecosystem services are largely missing from current models. The growing awareness of such threats is leading to a call for a new generation of models (Stern 2013), in which a range of probabilities are assigned to these very high-cost outcomes.
3. The Prospects for Greener Growth
Are alternative paths available with today’s technology (and expected nonbreakthrough progress) that will promote resource sustainability and allow healthy rates of economic growth to continue indefinitely?
Evidence suggests that it is possible to decouple environmental damage from growth, decarbonize production, use resources more efficiently, farm differently, and design smarter urban infrastructure at a reasonable cost (1–3 percent of GDP per year). Traditional models suggest that such action would result in a modest reduction in the rate of overall economic growth, at least in the short run. More recent analysis, in which technological change is endogenous, suggests that the impact on growth could even be positive.
Moving from current to “greener” paths will require two interrelated transitions. The first is the decoupling of environmental damage and growth (a special case relates to climate change and the decarbonization of the economy). The second transition will involve a major increase in the efficiency with which resources are used and reused in the production process.
3.1 Decoupling Economic Growth from Environmental Damage
Since the early 1990s, there has been a lively empirical and theoretical debate over the existence of environmental Kuznets curves (that is, whether environmental damage first rises with income levels and then falls) (World Bank 1992; Grossman and Krueger 1993). For some forms of damage—local pollutants with well-understood health costs and modest costs of abatement—the evidence appears to strongly support the hypothesis. The mechanism can involve citizens’ voice leading to public action, or it can simply be the result of compositional shifts in output and advances in technology (Andreoni and Levinson 2001; Brock and Taylor 2005; Smulders, Bretschger, and Egli 2011). History is full of examples of environmental crises leading to tipping points in public and official opinion and rapid action, in a manner that would not have occurred at lower income levels. The “Great Stink” of London in 1858—in which the extreme odor, new knowledge about cholera, and new sanitary technology led to major legislation being passed through Parliament in just 18 days for the construction of a sewerage system—was among the most dramatic but by no means the first or last case in modern history.
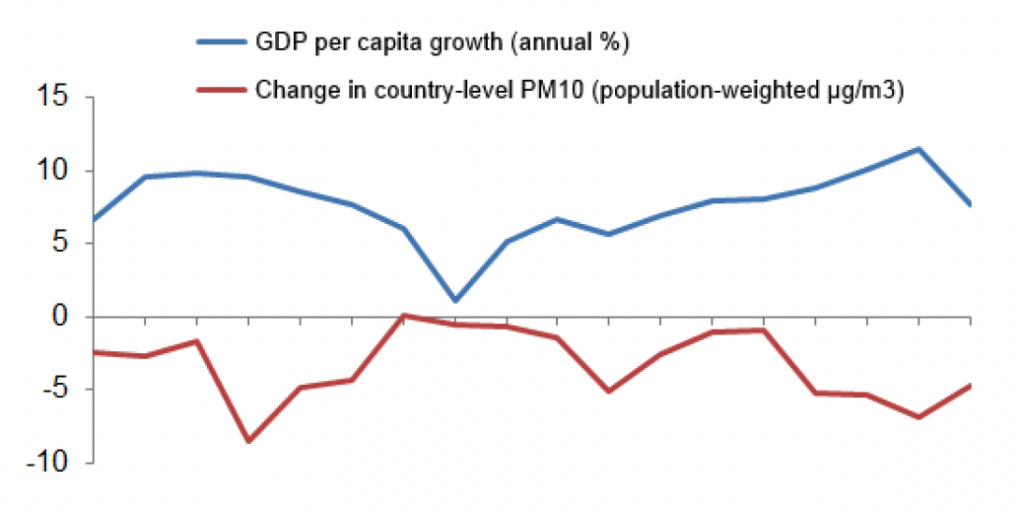
Global and longer-term challenges show a much weaker tendency, as a result of the absence of paths for citizen voices to be heard, weaker knowledge, and the need to allocate costs among competing nations. Consider the case of East Asia, which has been growing faster than any other region. Simple air pollution (PM10) has been decreasing there since 1990, even as real output has risen more than fourfold. In many places, levels are still well above levels recommended by the World Health Organization, but their level is declining (figure 3.1).12 Indeed, it can legitimately be argued that growth has enabled and created the demand for progress. Figure 3.2 shows a counterintuitive acceleration of progress on reducing particulates during periods of high growth. One has to be careful not to read too much into these data, but there is strong evidence that higher growth makes resources available to invest in pollution control.
Figure 3.1 Air Pollution, Energy Use, and GDP in the East Asia and Pacific Region, 1990–2008
(1990 = 100)
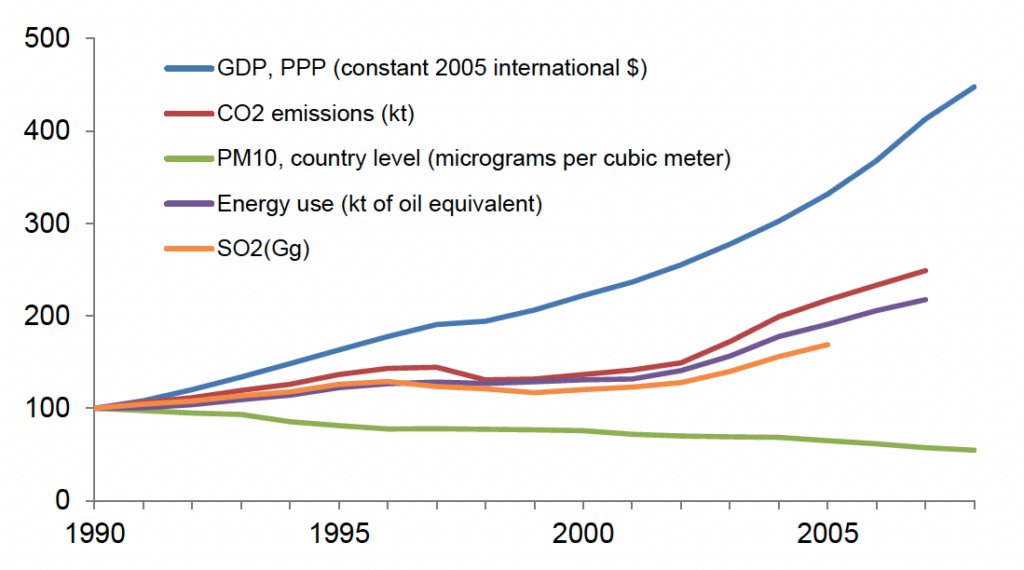
As might be expected, this pattern is less evident for pollutants that cost more to address and for which the health impact is less severe. Figure 3.1 shows that reductions in sulfur dioxide emissions, for example, have been much less pronounced in East Asia, although they may be approaching an inflexion point. Chinese sulfur dioxide emissions, which account for a quarter of the global total, increased at an annual growth rate of 7 percent between 2000 and 2006, as a result of the massive expansion in coal-fired power plants. Since 2006, sulfur dioxide emissions have begun to decrease, because of flue-gas desulfurization and the closing of small inefficient units (Lu and others 2010). This trend has been induced mainly by government policies aimed at reaching the targets set in China’s 11th (2006–10) and 12th (2010–15) Five-Year Plans. This inflection point in China illustrates an important interaction between income, policy, and technology. Increased resources and the declining costs of technology made a major shift in the way power is generated attractive, but the change was facilitated only as a result of strong government policy (World Bank 2010).
12 Other forms of pollution, such as PM2.5, remain at record levels in some cities, and as the air pollution crisis in China indicates, one should not count on any automatic tendency for a solution to pollution.
Figure 3.2 Faster Growth, Lower Pollution? Particulates and Economic Growth in the East Asia and Pacific Region, 1990–2007
The same principles underlie the use of energy. In 1990, East Asia used more energy to generate a unit of GDP than any other region in the world. In the past two decades, it made more progress than any other region, cutting energy intensity in half.
Parallel to the gains in energy efficiency has been the overall reduction in carbon intensity of East Asian economies—although these economies continue to exhibit the highest carbon emissions-to-GDP ratio of all regions (figure 3.3). Driving a wedge between GDP and carbon emissions is a societal choice, as shown in figure 3.4, which compares the recent trajectories of Denmark and China.
Figure 3.3 Carbon Intensity of GDP, by Region, 1990–2007
(CO2 kg per 2005$ of GDP)
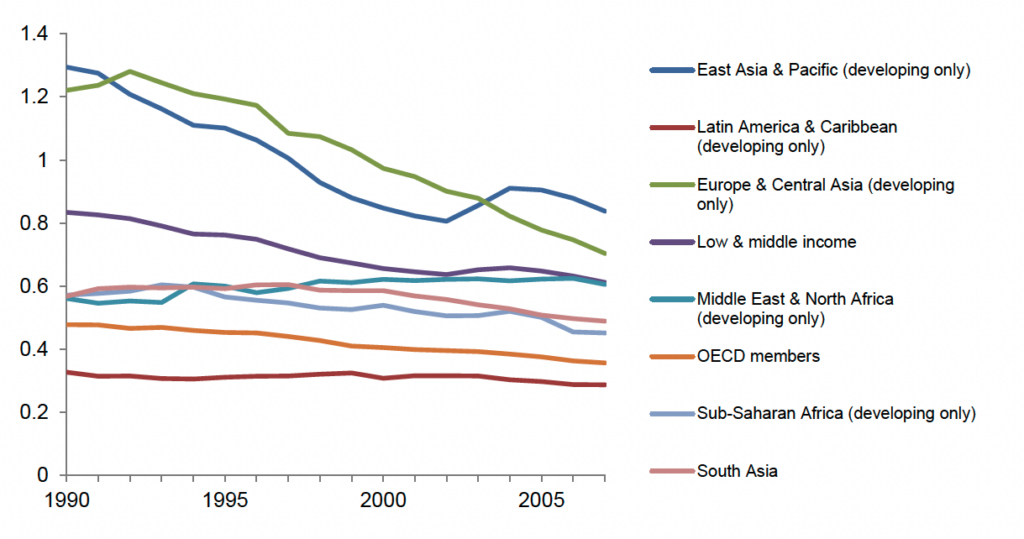
Figure 3.4 Carbon Intensity of GDP in Denmark and China, 1990–2005

3.2 Decoupling Growth from Greenhouse Gas Emissions: Limitations of Cost-Benefit Analysis
The global nature of the externality, coupled with the perceived high cost of action and the long-term and uncertain nature of the impacts may explain why greenhouse gases have shown no evidence of fitting within the environmental Kuznets curve framework. Estimates of the costs of addressing climate change depend not only on the depth and speed of cuts but also on numerous assumptions regarding technology and cost trends, substitution elasticities, and the like. The Stern Report estimated the costs of stabilizing greenhouse gas concentrations at 500–550 ppm CO2e, which, according to the IPCC’s Fourth Assessment (2007), would lead to an average temperature rise of about 3°C) to be on the order of 1 percent of GDP a year through 2050. It estimates the cost of stabilizing emissions at 450 ppm CO2e (which would provide about a 50 percent probability of limiting average temperature rise to 2°C) at about three times greater.
Given the stock nature of the problem—that is, the fact that the problem slowly builds as the stock of greenhouse gas emissions rises—the time trajectory of emissions matters: each year of delayed action can raise costs. To limit atmospheric concentrations to 450 ppm, the allowable “emissions budget” from fossil fuels and land use change in the first half of the current century is about 1,440 gigatons (Meinshausen and others 2009). Between 2000 and 2011, 420 gigatons were emitted, and another 136 gigatons from nonenergy sources is expected to be emitted through 2050, leaving an allowable budget of about 884 gigatons for 2012–50, or an average of about 23 gigatons per year. Current annual emissions are estimated at about 32 gigatons (IEA 2012a) and are still rising. Delaying action means that more will need to be done in the remaining years, with cost increases compounded as emissions are increasingly “locked in” as a result of ongoing infrastructure investments.
The Stern Report calculated the annual deadweight loss to the economy without estimating the impact on the growth rate. Other estimates, such as the Environmental Outlook to 2050 (OECD 2012), explore the impacts on growth. Under an aggressive program to accelerate the energy and agricultural transformation and stabilize emissions at 450 ppm CO2e, the OECD projects that the average annual world growth rate would decline from 3.5 percent in the baseline scenario to 3.3 percent, yielding a world GDP that is 5.5 percent lower in 2050 than under the baseline scenario. Stabilization at 550 ppm would cost as little as 1 percent of real income. Moreover, these numbers fail to take into account positive feedback impacts on growth from such policies. They thus likely overestimate the costs. The OECD report finds that the costs of inaction would reduce global consumption by 13 percent. It thus concludes that the proposed actions are warranted.
Conventional cost-benefit analysis yields results based on three sets of calculations: the future streams of benefits and costs of action and the discount rate that enables them to be compared. On all three sets of calculations, there may be a bias encouraging inadequate action on climate change. First, on the costs of climate change (the benefits of action), most calculations fail to account for the risk of catastrophic impacts. Weitzman (2009) suggests that this failure—and the difficulty of addressing such unknowable risks with existing tools—may render conventional analysis of little value. Second, an emerging literature suggests that although the costs of inaction may be seriously underestimated, the costs of action may be overestimated (as discussed later in the context of green growth). Third, ethicists and most economists differ regarding discount rates.
3.2.1 Discount Rates Matter
The economic case for urgent action on climate change depends in most studies on low discount rates. The reason is clear: the worst impacts of climate change will occur decades from now, whereas the costs of action must begin in earnest today. The power of discounting is huge in affecting the weight given to future events. A discount rate of 6 percent makes a benefit of $100 a century from now worth only 25 cents today.
In the tradition of Frank Ramsey, the discount rate, r, is the sum of two components:
r = δ + ηg
where δ is the rate of pure time preference, g is the growth rate of per capita consumption, and η is the elasticity of marginal utility of consumption, measuring how much utility drops as consumption increases.
There have been disagreements on both components of the discount rate. One senses that the economics profession, aided by ethicists and philosophers, is moving toward acceptance of a lower (zero or near zero) pure rate of time preference, on the simple grounds that all generations should be treated equally. This intuitively ethical notion follows a long tradition of economic thought, including contributions by Frank Ramsey, Arthur Pigou, Roy Harrod, Robert Solow, James Mirrlees, and Amartya Sen (Stern 2008). Nonetheless, it represents a shift from mainstream economic theory (Nordhaus 2007; Weitzman 2007), which argues that such an assumption is inconsistent with observed savings behavior of individuals and that assuming a low rate will hurt future generations because it will result in less growth and less prosperity being available to them. The Stern Review argued that morality and common sense call for a pure rate of time preference very close to zero and assumed a rate of 0.1 percent (different from zero as a result of the small but not inconceivable possibility that future generations will not exist).
The second term in the discount rate identity reflects the fact that if future generations will be richer than the current one, there is less need to invest today for their benefit. Here, too, there are grounds for disagreement. The future path of income and consumption is often assumed to be independent of decisions made on climate change. But in the absence of action against climate change, it would be foolish to assume that future generations will be better off than the current one. In such circumstances, the second term in the Ramsey equation may need to be negative, giving greater weight to the future than the present, thereby making an irresistible case for strong immediate action on climate change.
Another concern relates to distributional issues. Even if the average citizen in 2050 will be better off than today’s average citizen, the impacts of climate change will be highly unequal, with the poor bearing the brunt. Compensation schemes from the richer to the poorer may be possible, but they will almost certainly not occur.
The Stern Review assumed per capita consumption growth of 1.3 percent and a unitary elasticity of utility with respect to consumption. Adding the two components yields a discount rate of 1.4 percent. This discount rate is much lower than the rates in traditional economic models, which can be as high as 6 percent, with huge implications for the overall result. Benefits of $100 a century from now, discounted to the present using a 1.4 percent rate, will be worth 100 times as much ($25) as when discounted by 6 percent (25 cents).
3.2.2 Three Reasons to Rethink Conventional Wisdom
Does new understanding of “green growth” offer new opportunities for economic growth as well as the quality of life? Are the costs of action on climate change, as conventionally measured, overestimated?
In the past few years, the concept of “green growth” has been popularized, in part replacing the concept of “sustainable development.” At root, its distinctive insight is that environmental problems can be turned to good advantage. Smart environmental and growth policies combined can actually promote efficiency gains and technological advances, increase investment, and generate competitive advantage, the argument goes.
Belief in green growth may help explain why more than 50 developing countries are now imposing costs on themselves (through feed-in-tariffs, renewable energy standards, and so forth) that at first sight seem not to be in their country’s narrow interest. China, for example, introduced cap and trade policies for CO2 emissions on a pilot basis in 2013, with a nationwide program planned for 2015. A large research agenda lies ahead in this field, with the issue of “green jobs” acting as a strong political impetus in many countries.
New empirical and theoretical insights suggest that economists need to rethink their models of how an economy adjusts to tighter environmental policies, for three main reasons:
- Numerous win-win gains that would benefit both efficiency and the environment are being left unexploited, as a result of a range of barriers, rigidities, and market imperfections. New understanding from psychology and behavioral economics helps explain why these opportunities remain unexploited and how rising concerns about resource depletion can help unlock these constraints.
- Smart market-based environmental policies, coupled with public-private partnerships in technology research, can trigger innovation and investment that can create new markets, jobs, and economic growth.
- Risks about the future impact of climate change, compounded by growing belief by the business community that policy action to address climate change will occur in the future, is leading to concerns about “stranded assets,” a reduction in the appetite for investment, and a plea for a consistent long-term policy framework.
These three are discussed in the next three sections. All argue for early action on climate change.
Figure 3.5 Estimated Costs of Abating Global Greenhouse Gas Emissions
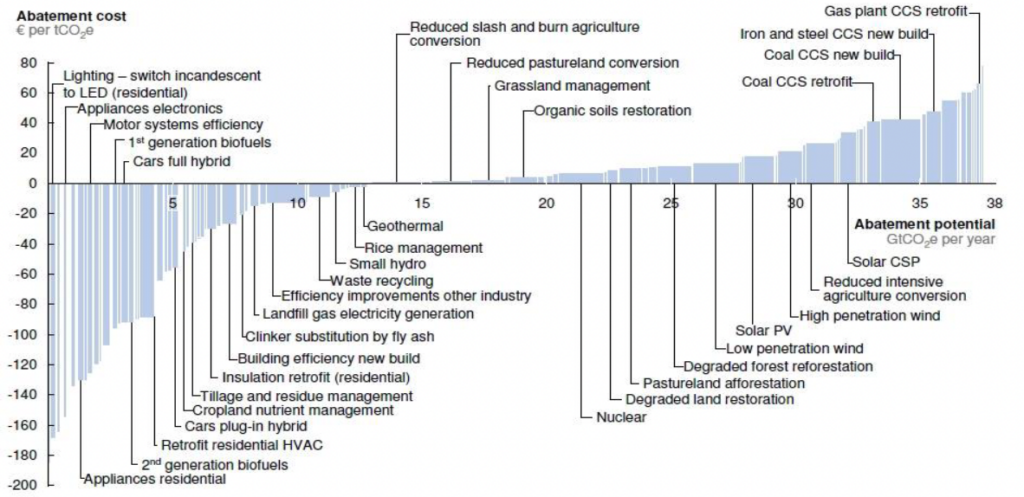
Note: Interventions below the horizontal -axis are “no-regrets” options.
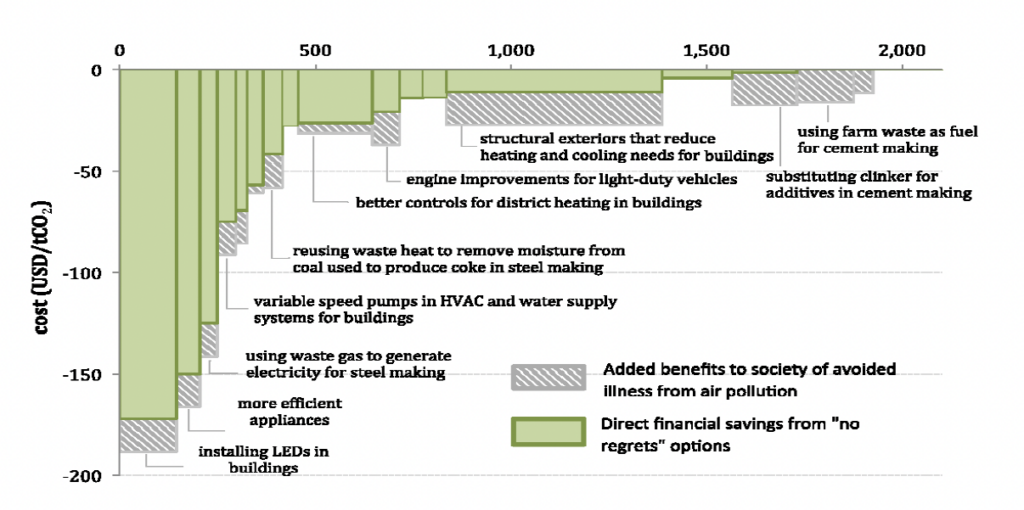
The first two mechanisms are illustrated by the marginal abatement cost curve shown in figure 3.5. Beneath the horizontal axis are a range of investments, much larger than earlier thought, that have positive returns independent of their benefits for the environment. These investments often remain largely unexploited. Investments in energy efficiency, which have been shown to have extremely high rates of return, are the iconic example of such opportunities. One hundred dollar bills are systematically left on the sidewalk as a result of a range of barriers associated with principal-agent issues, information gaps, operational policies of financial institutions, and so forth (Jaffe and Stavins 1994). These opportunities are not free; they require investment, but the investments pay for themselves in a commercial sense in the short run. When local environmental co-benefits, in the form of pollution reduction, are included, these investments become even more attractive (figure 3.6). The urgency of acting on climate and environmental issues can help unlock some of the barriers preventing action.
Figure 3.6 No-Regrets Options for Reducing CO2 Emissions in China, Adjusted for Local Environmental Benefits
3.2.3 Resource Efficiency
For many years it has been understood that efforts to improve resource efficiency will also benefit climate change and the environment (World Bank 1992; Steer 1992). But how much are these agendas overlapping, and how much of the reduced emissions required to address climate change can be obtained from investments that are justified on efficiency grounds alone? The answer appears to be about half in the period up to 2030.
The most complete effort to date to analyze these win-win options is provided by McKinsey’s Resource Revolution: Meeting the World’s Energy, Materials, Food and Water Needs (2011). Between 2010 and 2030, global resource demand is likely to grow 27 percent for food, 33 percent for energy, 41 percent for water, and 80 percent for steel. Meeting such demand can be done by increasing supply or using existing resources more efficiently. The study estimates costs and benefits of both options. It finds that increasing efficiency requires more upfront capital but yields a much higher rate of return than investments required to increase the supply of food, energy, water, and steel, which would require annual investments of $3 trillion through 2030—roughly $1 trillion per year more than was invested in the recent past. Such investments would come at a time in which global risk capital is likely to be expensive and geopolitical and environmental risks high.
Resource-efficiency gains will be insufficient to address growing demand for resources, but an extra $900 billion per year of investment in efficiency would reduce the needed investment in supply by $700 billion. More important, by 2030, it would yield annual savings to society of $2.9 trillion. Of the 150 resource productivity measures examined, the top 15 account for 75 percent of the benefits.13
Such “no-regret” investments deliver nearly half the required adjustment in greenhouse gas emissions, a number broadly consistent with a range of other climate studies. In order to stabilize greenhouse gas concentrations at 450 ppm, global emissions would need to be reduced from a projected 61 gigatons in 2030 under a “business as usual” case to 35 gigatons. A full set of resource productivity investments would reduce the figure to about 48 gigatons.
3.2.4 Directed Technical Change
Although such win-win options can thus solve about half of the problem, they are not enough. Measures beyond “no regrets” are required. Whether it is possible to implement these measures in a way that does not impose a drag on output and growth remains an open question. Above the horizontal-axis in figure 3.5 are opportunities that in a static context do not pay for themselves; these investments will not be adopted in the absence of regulation or government incentives. Conventional economic thinking held that such policies would impose costs on the economy. More recent analysis, beginning with Porter and van der Linde (1995), suggests that policy promotes innovation that reduces the cost of regulation (the weak Porter hypothesis) and can lead to increased competitiveness and profitability (the strong Porter hypothesis). The weak hypothesis has been widely supported by empirical studies. Evidence for the strong hypothesis has been mixed, with more recent studies tending to be more supportive (Ambec and others 2011).
13 The top five measures are building energy efficiency, increasing yields on large-scale farms, reducing food waste, reducing municipal water leakage, and making urban areas denser (leading to major transport efficiency gains).
Acemoglu and others (2011) provide the theoretical underpinning for this hypothesis and for an activist role for government. Many traditional computable general equilibrium models assume exogenous technology, with no learning; in these models, the costs to growth of action on environmental problems can be substantial. Such approaches tend to come out in favor of gradual environmental policy changes. But the evidence is clear that technology responds quickly to price and policy shifts. Patent data have been used in a number of studies to illustrate this point. Figure 3.7 shows how patent applications have responded to environmental regulations and awareness. Acemoglu and others demonstrate that a combination of a carbon tax and directed public expenditures on research can result in no decline in growth and an optimization of intertemporal welfare.
Figure 3.7 Index of Innovation in Climate Change Mitigation Technologies, 1975–2007
(1990 = 1)
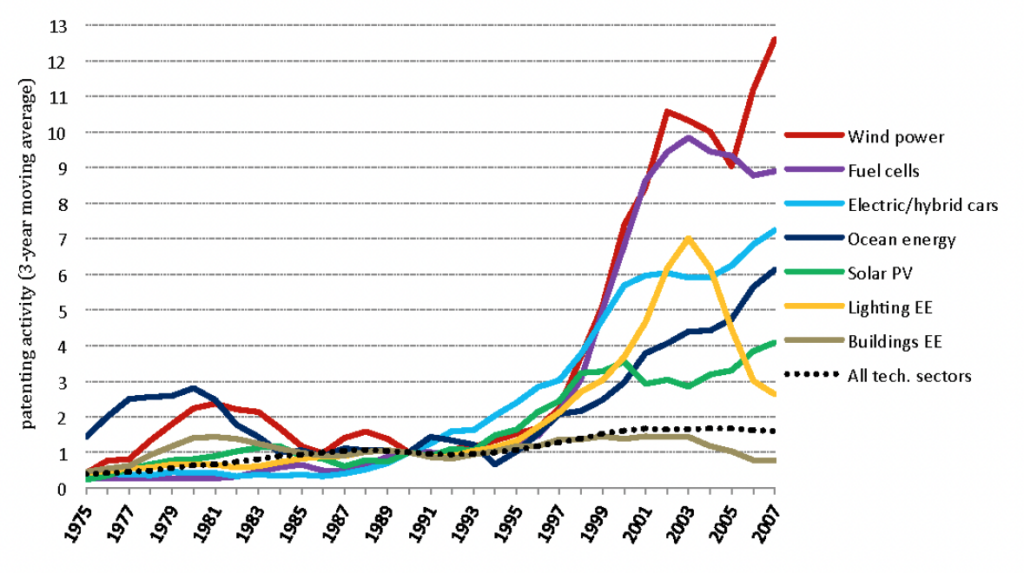
Note: Figure shows total worldwide applications in the EPO PASTAT database by priority date. It includes only “claimed priorities” (patents for which an application was filed at an office other than the original “priority” office).
A small number of empirical modeling exercises work on similar lines. On behalf of the German government, Jaeger and others (2011) explore the impacts on European economies of more ambitious climate targets. Their model allows for learning by doing and recognizes that clearer policy signals from the government on the needed move toward a greener economy could shift investor expectations and build confidence. It indicates that a unilateral commitment by the European Union to increase its ambition in abating climate change from its existing commitment of a 20 percent reduction in greenhouse gas emissions by 2020 to 30 percent over a 1990 baseline would lead to higher investment, growth, and competitiveness. This result contrasts sharply with most existing models, which conclude that greater ambition would reduce growth.
3.2.5 New Understandings of Investment: Climate Change Delays Investment
A third reason to believe that tighter environmental policy and near-term economic growth may be positively rather than negatively linked relates to new understanding of investment behavior. The past two decades have yielded new insights into how common characteristics of investment decisions—in particular their irreversibility, their context of uncertainty, and the ability to choose their timing—suggest that options theory rather than maximization of net present value has better predictive value in explaining how decisions are made (Dixit and Pindyk 1994). These insights help explain why, for example, investment is surprisingly unresponsive to interest rate changes yet highly responsive to changes in outlook.
They also shed light on common concerns expressed by the investor community, which faces a double uncertainty related to climate change. First, investors are increasingly concerned about the possible impact of climate change on returns. Second, a growing number of investors are concerned about the expectation that at some stage in the future price signals will shift sharply as new climate policies are implemented with great urgency. Both risks are growing and may be reaching the stage at which major investment decisions are delayed and overall investment is lower than it would otherwise be. Concerns are rising rapidly about the possibility of “stranded assets”—capital stock that appeared a good investment at the time but whose value is sharply diminished by a changing policy context or a changing climate. These concerns explain why a growing number of major corporations are calling for a price on carbon to be introduced now, to provide greater predictability of investment returns. It is the voices of these people that provide perhaps the greatest hope for early action.
3.2.6 Green Growth and Jobs
For the three reasons above, tighter environmental policy, carefully chosen and phased, can lead to increased investment and higher growth. An important test for the green growth hypothesis has been to look at shifts in the demand for skilled labor following the tightening of environmental policy. A review of 21 country studies (ILO 2011) shows a shift in labor demand: across industries, away from polluting and toward more modern sectors; within industries, toward greener activities, driven by profitability; and toward totally new occupations, induced by environmental policies. There is also evidence of labor market shortages in skills required for a low-carbon and resource-efficient economy, which undermines the effectiveness of environmental policies and prospects of dynamic gains in competitiveness.
The impact of environmental policies on jobs is of great political importance, and forms a link to trade policy. Critics of environmental legislation commonly criticize its “job-killing” characteristics. There has also been a view that tighter environmental controls in one country will lead to outmigration of dirtier industries to countries with looser controls. There is almost no evidence to support the notion that tight environmental policies and open trade and capital movements lead to job migration. Firms move—but pollution abatement costs represent too small a share of total costs to make the difference (Copeland 2012).
Low-carbon development is generally relatively labor intensive; it therefore probably has a net positive impact on employment, but knowledge gaps remain (Bowen 2012; Fankhauser, Sehlleier, and Stern 2008). Renewable energy and energy-efficient investments employ much larger numbers of workers than fossil fuel production and transmission; recycling and retrofitting are also labor intensive. The renewable energy sector employed more than 2.3 million people in 2006. The sector has grown very rapidly since then, with China accounting for the largest share. Some 10 million people are believed to be employed in recycling in China (UNEP 2008). The Chinese government estimates that energy efficiency and environmental protection will generate more than 10 million jobs over the next 5–10 years; exports of green goods could create 4–8 million jobs. In the United States, an estimated 1.3 million jobs were created in recycling in 2006 alone (Bezdek 2007).
A recent study of South Africa (World Bank 2011b) finds that although developing green industries could have a cost-effective benefit on new jobs, it will do so only if labor market and regulatory obstacles are also addressed. Investment in research and development (R&D) in green industries will do little if educational and financial systems produce few skilled workers and little risk capital. The key conclusion: Green growth requires not only good green policies but also good growth policies.
4. Policies and Politics of Low-Carbon Growth
Three considerations are important when thinking through a low-carbon growth policy framework to move from current to more sustainable paths:
- Although the tools needed to internalize externalities have been well known for decades, they are generally not adopted, for a range of well-known (and lesser-known) reasons. The political economy and psychology of policy prescriptions need to be of central concern.
- The level of uncertainty and potentially irreversible threshold effects implies that the value of conventional cost-benefit analysis may be severely limited and that precautionary principles should drive action.
- The global nature and intergenerational implications of today’s resource depletion problems present challenges of collective action that appear to be well beyond the means of current governance mechanisms to address. Meeting these challenges will demand new approaches.14
- Although climate change is easily understood as the result of a fundamental market failure (the lack of property rights and thus a market value of climate services), it actually reflects several market failures (Stern 2013), each requiring different instruments.
14 See Matoo and Subramanian (2013) for a lively exploration of this theme.
In the light of these, actions to address climate change—and many other environmental externalities—require a great deal of creativity and a combination of policies.
The scale and nature of the challenge is captured in figure 4.1 (IEA 2012b), which shows possible trajectories for energy related emissions (which account for two-thirds of total greenhouse gases). Under current policies and practices, emissions will continue to rise into the indefinite future. Fortunately, more than 90 countries have made statements of intent to address greenhouse gas emissions. The New Policies scenario captures these goals, which, while laudable, are inadequate to the task. The Efficient World Scenario assumes that all countries exploit the win-win opportunities (options that can be justified purely on efficiency rather than environmental grounds). Although this scenario slightly reduces greenhouse gas emissions, further policies and investments are required from the section of the marginal abatement cost curve above the horizontal axis (figure 3.5).
Figure 4.1 Alternative Scenarios for Global Energy-Related CO2 Emissions, 1990–2035: Growing Gap between Current Policies and What Is Needed
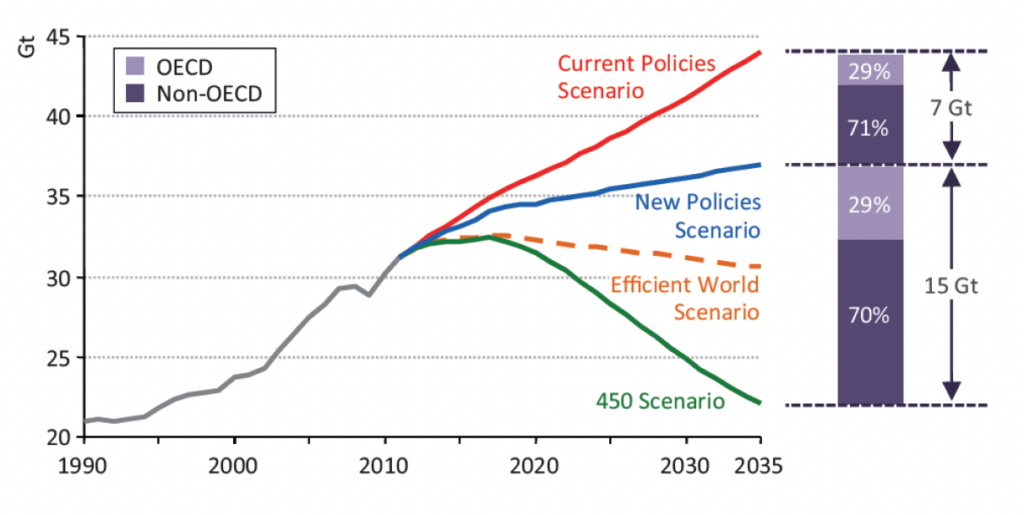
Note: The Efficient World Scenario assumes that the long-term economic potential of energy efficiency is realized by 2035. The 450 (ppm) Scenario is consistent with limiting global warming to 2°C above preindustrial levels. Almost two-thirds of emissions come from non–OECD countries in the New Policies Scenario; emissions avoidance in these countries makes up the majority of abatement in the 450 Scenario.
Figure 4.1 highlights two important features of the challenge. First, global emissions will need to peak by 2020 if concentrations are to be limited to 450 ppm; delays beyond this point would increase the costs sharply, probably making the task politically and economically prohibitive. Second, about 70 percent of the reduction from a business-as-usual path needs to be achieved outside the OECD, illustrating the urgent need for international cooperation (see section 4.4).
4.1 Removing Subsidies on Fossil Fuels
Subsidies on fossil fuel production and consumption are pointing economic agents in the wrong direction and wasting large sums of money that could be used to help set economies on more sustainable paths. Such subsidies cost about $400 billion per year in emerging and developing counties, mainly in the form of consumption incentives, and about $50–$80 billion in advanced countries (OECD 2012), more often in the form of production incentives. If the subsidy is measured not with regard to the free market price of the energy source but with regard to what the price should be (after adjusting for the rate of optimal taxation and negative externalities), the global subsidy is much higher, amounting to $1.9 trillion in 2011, about 2.5 percent of global GDP or 8 percent of total public revenue (IMF 2013). Eliminating such subsidies would reduce global CO2 emissions by 13 percent—and, if well spent, help economic growth. By contrast, total global public research on renewable energy is less than $100 billion a year.
Subsidies encouraging the overuse of other natural resources account for another $500–$800 billion per year (McKinsey 2011; World Bank 2012a).15 Water subsidies for groundwater extraction and irrigation systems account for $200–$300 billion per year. Public subsidies for fishing amount to $10–$30 billion per year, mainly in the form of direct cash payments, concessional credit, and insurance subsidies (UNEP 2011b). Agricultural subsidies account for another $370 billion (OECD 2011), although not all are environmentally harmful.
15 These estimates come from a variety of studies by multilateral institutions and academic researchers. Because the data are sometimes unreliable and definitions complex, estimates vary widely. These estimates appear to be roughly in the mid-range.
The benefits of removing such subsidies have been discussed for decades, but these subsidies remain as high as ever, as a result of the political difficulties of removing them. A few governments (for example, Indonesia and Iran) have demonstrated that using savings from subsidy reduction to provide cash transfers to the lower third of the income distribution can enable such price adjustments without increases in poverty and with manageable political fall-out. Modern information technologies that enable the targeting of compensation programs open up new opportunities for doing things better.
Removing subsidies has more than just first-round effects; cost savings make other initiatives possible. In East Asia, for example, the estimated additional net financing required (above the gains form investments in energy efficiency) for a sustainable energy path is $80 billion per year. If implemented in conjunction with removing the $70 billion per year the region currently spends on fossil fuel subsidies, the new path becomes economically and politically attractive (Wang and others 2010; IEA 2008).
4.2 Pricing Carbon
Beyond subsidy removal, a price on carbon is required. Market-based mechanisms can be significantly more cost-effective than regulatory regimes. The adoption of permit trading for sulfur dioxide in the United States in the 1990s yielded annual compliance costs savings of more than $300 million over standards-based regulation, as a result of the flexibility it gives polluters to find solutions (Anthoff and Hahn 2010).
A number of studies have sought to calculate the appropriate price of carbon. Economists argue that it should be set by calculating the point at which two curves intersect. The marginal abatement cost curve captures the rising cost of reducing each ton of greenhouse gases as the level of ambition increases. The marginal benefit curve captures the falling marginal benefit from each ton not emitted as the level of ambition rises. The social cost of carbon is estimated by calculating where these curves intersect—that is, where the marginal benefits and costs are equated. This calculation requires the use of cost-benefit analysis and is thus subject to the weaknesses discussed earlier in this paper. Estimates tend to range widely, based on the assumptions made about discount rates and the likely impacts and costs; they tend to be lower than many scientists would support, given the inability of existing tools to capture the possibility of extreme events.
Tol (2004) combines 103 estimates to produce a probability-density function of the social cost of carbon. He finds a median of $14 per ton and a mean of $93. The IPCC Fourth Assessment notes that peer-reviewed estimates of the social cost of carbon averaged about $12 per ton of CO2, with a range of –$3 to +$95. The U.S. government–convened Interagency Work Group came up with a “central value” estimate of the social cost of carbon of $21 per ton of CO2 (U.S. EPA 2010; see Hausker 2011 for a critical assessment).
Carbon can be priced by imposing either a carbon tax, which would provide certainty on the price but no guarantee on the impact on emissions, or a quantity cap, which would guarantee quantity impact but create uncertainty over the price. In a world of perfect information, the two would be fully equivalent. The choice in the real world depends on whether it is more important to have certainty on the limits on carbon emitted (the view of many scientists and environmentalists) or confidence on the prices faced by investors and consumers and the revenues raised (the view of many ministries of finance, on the grounds that price and revenue volatility is inefficient). The fact that confidence on both emissions and prices is desirable has led to the design of hybrid approaches that combine quantity and price targets.
The countries of the European Union have led the way in placing a price on carbon, choosing a cap-and-trade system. The EU Emissions Trading Scheme, which accounts for more than 90 percent of all global trades, and the Clean Development Mechanism (CDM), the global offset system introduced under the Kyoto Protocol, illustrate both the strengths and weaknesses of a cap-and-trade system. They have significantly reduced the cost of mitigation within Europe. In addition, by purchasing credits through the CDM, Europeans and other participants have provided finance for more than 6,500 projects in the developing world with a combined investment of more than $350 billion in low-carbon development (Purvis and others 2013).
However, the price of carbon in international markets has been driven by the ambition of EU targets rather than any rational calculation of the social price of carbon. When the EU goals of reducing greenhouse gas emissions by 20 percent by 2020 were set, it was assumed that the recovery from the economic crisis would be relatively prompt, promoting demand for more energy. The economic stagnation in Europe since 2008 has made the greenhouse gas targets for 2020 relatively easy to achieve, driving down the carbon price within Europe and globally (figure 4.2). This trend has not only created economic uncertainty but has undermined confidence in carbon markets, as much of the infrastructure—brokerage firms, developers, and so forth—exited the markets or sharply cut back operations. Price signals facing investors are now discouraging action on climate change, not because the problem has lessened (it has seriously worsened) but because the depth of the recession was underestimated. In this situation, a carbon price would have been preferable to a cap-and-trade system.
Figure 4.2 The Unpredictable Price of Carbon: Carbon Offset Prices Transacted through the Clean Development Mechanism, 2008–12

The long-term prospects for carbon markets, however, remain strong, as a result of the sheer need to act soon to prevent a catastrophe. A number of countries and regions are introducing trading schemes in that anticipation. In 2012–13, Australia, China, California, Kazakhstan, the Republic of Korea, and Quebec are all designing, launching, or deepening their trading systems. Australia’s program covers 60 percent of emissions and combines a price and trading element. In 2013, China begins trading in seven cities and provinces accounting for more than 25 percent of national GDP; these pilots will inform the design of a nationwide program by 2015. India has chosen an innovative variant by introducing a trading scheme for Renewable Energy Certificates (RECs), whereby obligations to increase the share of renewable production can be met through market transactions. Korea has passed legislation to introduce emissions trading by 2015 as a key element of its “green growth” proposals.
4.3 Climbing the Marginal Abatement Curve: Addressing Other Market Failures
Although placing a price on carbon is perhaps the single most important measure required, it is not enough. The unpriced global externality caused by greenhouse gas emissions is not the only market failure (Stern 2013). Information asymmetry, coordination failures (the need for networks), imperfections in capital markets and R&D, and the existence of substantial co-benefits in the form of other environmental benefits, are all discouraging action on climate change. They must be addressed through a portfolio of policies.16
Emissions standards, applied carefully and phased in over time, have been found to have high rates of economic return, even when they require significant investment for compliance. The benefit-cost ratio of the U.S. Clean Air Act, for example, is estimated to be 25:1 by 2015 (U.S. EPA 2011). Compliance costs have been consistently found to be lower than predicted by industry associations and to promote technology responses that are greater than anticipated. A notable example is vehicle standards (An and others 2007). In some instances, such regulations are a second-best alternative to pricing measures, but in other cases they are effective complements—and, in the presence of information asymmetries, principal-agent problems, and other market failures, superior alternatives—to pricing measures.17 If the goal is to change household energy use, imposing (mandatory) energy efficiency standards and (voluntary) appliance labeling is much more cost-effective than, for example, placing taxes on electricity use.
16 For an overview of environmental policy choice, see Sterner (2003), and Goulder and Parry (2008).
17 Achieving the U.S. commitment to reduce greenhouse emissions by 17 percent between 2005 and 2020 will require a mix of regulatory standards and measures. Analysis at the World Resources Institute by Bianco and others (2013) shows how new power plant standards, methane leakage standards, the phase-out of hydrofluorocarbons, and new energy efficiency can, if firmly implemented, enable the goals to be reached at low cost and significant technological gain—even in the absence of political support for pricing measures, although these measures would be more effective in the presence of complementary pricing measures.
New insights from behavioral psychology help explain why individuals and even firms do not always respond to price signals. They are encouraging a new emphasis on “nudge” policies (Thaler and Sunstein 2009). Labeling, certification schemes, and power use monitors are examples that are proving effective. Relatedly, there is evidence that consumers and voters are biased toward the status quo: they tend to view new environmental policies as a burden while discounting the costs of existing or future environmental damage (World Bank 2012a). This phenomenon helps explain why it is very difficult to create political coalitions for strong action on climate change and suggests that progress could be greater if low-carbon choices were presented as the default option, with the high-carbon path an active choice (Picherta and Katsikopoulos 2008).
The role of government in the development of technology requires careful attention. Although price and nonprice policies can spur innovation, there is also a role for the use of public funds (Acemoglu and others 2012). To date, worldwide public spending on renewable energy and energy efficiency is dwarfed by public support for fossil-based energy (Bloomberg New Energy Finance 2010). Emerging economies like China and Morocco are adopting aggressive public spending programs to support renewables, however, and more than 40 countries now have feed-in-tariff arrangements to support investment in renewables. The past two decades have witnessed a birth of a new form of industrial policy in which externalities and spillovers are identified by public-private collaboration, and incentives and public spending have focused on addressing them (Rodrick 2004). Green technologies have been an important component of this trend.
Denmark became a global leader in wind technology through a focused program of support between the mid-1980s and late 1990s, combining market creation through feed-in tariffs and research support. China is an important current example in photovoltaic technology (De La Tour, Glachant, and Ménière 2011).
4.4 International Cooperation
As the greatest of all global market failures—and one in which the countries that caused the problem will not be those that will suffer most from it—climate change poses huge problems of international collective action, especially in an environment in which the costs of action have dominated the discourse and, too often, a zero-sum game mentality has pervaded negotiations. The United Nations Framework Convention on Climate Change (UNFCCC), which came into force in 1994 and has been ratified by 195 countries, has achieved some notable achievements, including the Kyoto Protocol, the introduction of global carbon trading through the Clean Development Mechanism, and a broad range of technical agreements on how to measure and account for greenhouse gas emissions. The failure of the Copenhagen Conference of the Parties (COP) in 2009 to deliver a global agreement was partly compensated for by the agreement to create a registry of voluntary (and nonbinding) commitments to reduce greenhouse gas emissions up to 2020. More than 90 countries have now registered such aspirations.18 They represent by far the greatest commitment to act against climate change ever. But adding up all the aspirations still falls far short of what is necessary (UNEP 2012), as the New Policies scenario in figure 4.1 shows.
18 For many developing countries, these aspirations are contingent on financing from developed countries. Sometimes two figures offered are offered—one independent of additional finance and a more ambitious one if adequate finance is forthcoming. Indonesia, for example, has committed to a reduction of 26 percent (from business as usual trends) to be achieved by its own efforts and finance and 41 percent if additional subsidized funding is forthcoming. Some countries have expressed greenhouse gas goals as a percentage of GDP. China, for example, has committed to reduce the carbon content of real GDP by 40 percent between 2000 and 2020.
Following the break-down of negotiations in Copenhagen, subsequent annual COPs—in Cancun, Durban, and Doha—sought to raise the level of ambition. Agreement was reached to finalize a global deal, with legal force, in 2015, to become effective in 2020. The goal would be to limit average temperature increases to a maximum of 2°C. Although this achievement is important, two serious problems remain. First, views differ vastly on the legal form of such a deal, with some insisting on a global treaty strictly limiting greenhouse gas emissions, with international penalties for violations, while others advocate a much looser, bottom-up “pledge and review” approach. The problem is complicated by the fact that UNFCCC rules specify that any decisions be made by consensus, which has been understood to mean that every country has veto power.19 As a result, few observers are optimistic that the degree of ambition, and subsequent impact, will be sufficient. Second, as noted earlier, although it is action in the current decade that will be essential if global emissions are to peak by 2020, in this critical decade there will be no global arrangements whatsoever.20
Although a globally inclusive intergovernmental agreement remains as essential as ever, it is clear that a process that allows any country, however small, to defeat any decision cannot be relied upon to solve a problem of such great global importance. Many observers regard today’s UNFCCC processes as indicative of the inadequacies of global governance mechanisms to address the key international problems of the current century (see the paper by Birdsall on this website). Calls for new approaches are growing.
The idea of smaller groupings of committed players helping to create momentum for change is a growing theme in international dialogue and practice. Existing regional blocs, such as the European Union, are demonstrating that greater ambition is possible when fewer players are engaged. New (voluntary) “clubs” are being designed to show that success is possible. Examples include the creation in the past three years of coalitions to address short-term air pollutants, new clubs of countries committed to renewable energy and energy efficiency, and governments committed to the adoption of green growth paths. Their purpose is to share information and technology, demonstrate that success can be achieved at reasonable (or negative) economic and political costs, and in some cases provide financial assistance to developing country members. Morgan and Weischer (2013) explore 17 such clubs, identifying the conditions under which they can help move the needle, increasing the likelihood of achieving a strong global deal.
19 At the conclusion of the Cancun COP, in 2010, the chair pronounced consensus, even though one country (Bolivia) was opposed. This decision was met with opposition among some parties as undermining the integrity of the UNFCCC process, but it provided new hope for more rational decision making.
20 A second commitment period under the Kyoto Protocol was agreed to at the Durban COP, in 2011, which will be effective during the current decade, but it includes only 37 countries, which together account for only 13 percent of global emissions. Its significance is political rather than substantive.
Many of the most innovative coalitions include private corporations, subnational governments, and civil society, as well as ambitious national governments. For example, the Sustainable Energy for All Initiative, led by the United Nations and the World Bank, consists of 77 countries; dozens of major corporations, financial institutions, and civil society organizations; and tens of billions of dollars of committed finance devoted to specific targets on renewable energy, energy efficiency, and universal access to electricity by 2030. The C40 grouping of the world’s major cities has made significant and specific commitments to reduce greenhouse gas emissions and to help one another do so through technical assistance, toolkits, and political support. None of these efforts can substitute for the need for a global deal, but they can help change the political and economic calculus, making such a deal more likely. An increase in such arrangements should be expected and encouraged, not only on climate change but also to address much broader issues of resource risks in the coming decades (see Lee and others 2012).
4.5 Facilitating Citizen Voice through the Marketplace
Governments rarely initiate efforts that lead to environmental progress. In most instances, it is citizens who demand change. The combined leadership of consumers and business leaders who recognize that continuation of present behavior is unsustainable now offers the greatest hope for change. Certification schemes and associated roundtables for a range of commodities, such as timber and palm oil, are playing a major role in preventing deforestation and reducing carbon footprints. More than 80 percent of Global 500 firms now report their carbon emissions—not because governments require that they do so but because institutional investors, led by citizen shareholders, demand it. New technologies (remote sensing, crowd sourcing, GPS tracking, and protocols for measuring emissions) are enabling green companies and products to distinguish themselves. Environmental auditing and voluntary disclosure schemes are springing up in support, slowly transforming supply chains among leading companies. Policy options exist that can make these efforts more effective.
4.6 Concluding Thought
These initiatives will play an important role in transforming economic processes toward a more sustainable footing. Sadly, they will not be sufficient unless they succeed in demonstrating that the benefits of climate action are greater than have been widely understood and the language of burden-sharing and costs is replaced with that of opportunity and greater well-being for citizens everywhere.
This area will be a big battlefield in the coming years. The stakes are high, and time is running out.
References
- Acemoglu, D., P. Aghion, L. Bursztyn, and D. Hemous. 2012. “The Environment and Directed Technical Change.” American Economic Review 102 (1): 131–66.
- Ambec, S., M. A. Cohen, S. Elgie, and P. Lanoie. 2011. “The Porter Hypothesis at 20: Can Environmental Regulation Enhance Innovation and Competitiveness?” Discussion Paper 11-01, Resources for the Future, Washington, DC.
- An, F., D. Gordon, H. He, D. Kodjak, and D. Rutherford. 2007. Passenger Vehicle Greenhouse Gas and Fuel Economy, Standards: A Global Update. Washington, DC: International Council on Clean Transportation.
- Andreoni, J., and A. Levinson. 2001. “The Simple Analytics of the Environmental Kuznets Curve.” Journal of Public Economics 80 (2): 269–86.
- Anthoff, A., and R. Hahn. 2010. “Government Failure and Market Failure: On the Inefficiency of Environmental and Energy Policy.” Oxford Review of Economic Policy 26 (2): 197–224.
- Arrow, K. J., P. Dasgupta, L. H. Goulder, K. Mumford, and K. Oleson. 2010. “China, the US, and Sustainability: Perspectives Based on Comprehensive Wealth.” In Is Economic Growth Sustainable? ed. Geoffrey Heal, 92–145. London: Palgrave MacMillan.
- Bai, Z. G., D. L. Dent, L. Olsson, and M. E. Schaepman. 2008. Global Assessment of Land Degradation and Improvement. 1. Identification by Remote Sensing. ISRIC (World Soil Information) Report 2008/01, Wageningen, Netherlands.
- Bezdek, R. 2007. Renewable Energy and Energy Efficiency: Economic Drivers for the 21st Century. American Solar Energy Society, Boulder, CO.
- Bianco, N, F. Litz, K. Meek, and R. Gaspar, 2013. Can the U.S. Get There from Here? Using Existing Federal Laws and State Action to Reduce Greenhouse Gas Emissions. World Resources Institute, Washington, DC.
- Bloomberg New Energy Finance. 2010. “Subsidies for Renewables, Biofuels Dwarfed by Supports for Fossil Fuels.” Press release, July 29.
- Bolinger, M., R. Wiser, and W. Golove. 2002. “Quantifying the Value that Wind Power Provides as a Hedge against Volatile Natural Gas Prices.” Proceedings of Windpower 2002. American Wind Energy Association, Washington, DC.
- Bowen, A. 2012. “Green Growth, Green Jobs, and Labor Markets.” Policy Research Working Paper 5990, World Bank, Washington, DC.
- Brock, W.A and M. S. Taylor. 2005. “Economic Growth and the Environment: A Review of Theory and Empirics.” In Handbook of Economic Growth, ed. P. Aghion and S. Durlauf, 1749–821. Amsterdam: Elsevier.
- CDP (Carbon Disclosure Project). 2012. CDP Global Water Report 2012. London.
- Copeland, B. R. 2012. “International Trade and Green Growth.” Paper presented at the Green Growth Knowledge Platform Inaugural Conference, Mexico City, January 12–13.
- Cropper, M. 2010. “What Are the Health Effects of Air Pollution in China?” In Is Economic Growth Sustainable? ed. G. Heal, 10–47. Palgrave Macmillan, London.
- DARA, and the Climate Vulnerable Forum. 2012. Climate Vulnerability Monitor 2nd Edition: A Guide to the Cold Calculus of a Hot Planet. Madrid.
- Dargay, J., D. Gately, and M. Sommer. 2007. “Vehicle Ownership and Income Growth, Worldwide: 1960–2030.” Energy Journal 28 (4): 143–70.
- De la Tour, A., M. Glachant, and Y. Ménière. 2011. “Innovation and International Technology Transfer: The Case of the Chinese Photovoltaic Industry.” Energy Policy 39 (2): 761–70.
- DeConcini, C., and F. Thompson. 2013. 2012: A Year of Record-Breaking Extreme Weather and Climate. Washington, DC: World Resources Institute.
- Dell, M., B. F. Jones, and B. A. Olken. 2009. “Temperature and Income: Reconciling New Cross-Sectional and Panel Estimates.” American Economic Review 99 (2): 198–204.
- Dixit, A., and R. Pindyk. 1994. Investment under Uncertainty. Princeton, NJ: Princeton University Press.
- European Environment Agency. 2013. Atmospheric Greenhouse Gas Concentrations. Copenhagen.
- Fankhauser, S., F. Sehlleier, and N. Stern. 2008. “Climate Change, Innovation and Jobs.” Climate Policy 8:
- Goulder, L. H., and I. W. H. Parry, 2008. “Instrument Choice in Environmental Policy.” Review of Environmental Economics and Policy 2: 152–74.
- Grossman, G. M., and A. B. Krueger. 1993. “Environmental Impacts of a North American Free Trade Agreement.” In The US Mexico Free Trade Agreement, ed. P. Garber, 165–177. Cambridge, MA: MIT Press.
- Hamilton, Kirk. 2010. “Wealth, Saving and Sustainability.” In Is Economic Growth Sustainable? ed. Geoffrey Heath, 76–92. London: Palgrave Macmillan.
- Hartwick, J. M. 1977. “Intergenerational Equity and the Investing of Rents from Exhaustible Resources.” American Economic Review 66: 972–974.
- Hausker, K. 2011. “The Social Cost of Carbon and Competing Decision Frameworks for Climate Policy.” Paper presented at the fall meeting of the American Bar Association, section on the environment, energy, and resources, Indianapolis, October 12–15.
- Heal, G., ed. 2010. Is Economic Growth Sustainable? London: Palgrave Macmillan.
- IEA (International Energy Agency). 2012a. “Global Carbon-Dioxide Emissions Increase by 1.0 Gt in 2011 to Record High.” Paris. http://www.iea.org/newsroomandevents/news/2012/may/name,27216,en.html.
- ———. 2012b. World Energy Outlook 2012. Paris: International Energy Agency.
- IFPRI (International Food Policy Research Institute). 2013. 2012 Global Food Policy Report. Washington, DC: International Food Policy Research Institute.
- ILO (International Labor Organization). 2011. Skills for Green Jobs. A Global View: Synthesis Report Based on 21 Country Studies. Geneva.
- IMF (International Monetary Fund). 2013. Energy Subsidy Reform: Lessons and Implications. Washington, DC.
- IPCC (Intergovernmental Panel on Climate Change). 2007. Climate Change 2007: Synthesis Report. Contribution of Working Groups I, II and III to the Fourth Assessment of the Intergovernmental Panel on Climate Change.
- IUCN (International Union for Conservation of Nature). 2004. A Global Species Assessment. Gland, Switzerland, and Cambridge, United Kingdom.
- Jaeger, C. C., L. Paroussos, D. Mangalagiu, D., R. Kupers, A. Mandel, and J. D. Tàbara. 2011. A New Growth Path for Europe: Generating Prosperity and Jobs in the Low-Carbon Economy. Synthesis Report. European Climate Forum, Potsdam, Germany.
- Jaffe, A., and R. Stavins. 1994. “The Energy-Efficiency Gap: What Does It Mean?” Energy Policy 22 (10): 804–10.
- Kharas, H. 2010. “The Emerging Middle Class in Developing Countries.” Working Paper 285, OECD Development Centre, Organisation for Economic Co-operation and Development, Paris.
- Lee, B., F. Preston, J. Kooroshy, R. Bailey, and G. Lahn. 2012. Resources Futures. Chatham House, London.
- Mattoo, Aaditya, and Arvind Subramanian. 2013. Greenprint: A New Approach to Cooperation on Climate Change. Center for Global Development, Washington, DC.
- McKinsey & Company. 2010. Impact of the Financial Crisis on Carbon Economics: Version 2.1 of the Global Greenhouse Gas Abatement Cost Curve.
- ———. 2011. Resource Revolution: Meeting the World’s Energy, Materials, Food, and Water Needs.
- Meinshausen, M., N. Meinshausen, W. Hare1, S. C. B. Raper, K. Frieler, R. Knutti, D. J. Frame, and M. R. Allen. 2009. “Greenhouse-Gas Emission Targets for Limiting Global Warming to 2°C.” Nature 458: 1158–62.
- Millennium Ecosystem Assessment. 2005. Ecosystems and Human Well-Being: General Synthesis. Washington, DC: Island Press.
- Miller, Kenneth G. Miller, James D. Wright, James V. Browning, Andrew Kulpecz, Michelle Kominz, Tim R. Naish, Benjamin S. Cramer, Yair Rosenthal, W. Richard Peltier, and Sindia Sosdian. 2012. “High Tide of the Warm Pliocene: Implications of Global Sea Level for Antarctic Deglaciation.” Geology 40: 407–10.
- Morgan, J., and L. Weischer. 2013. “Two Degrees Clubs: How Small Groups of Countries Can Make a Big Difference.” WRI Insights, World Resources Institute, Washington, DC.
- Müller, C., A. Bondeau, A. Popp, K. Waha, and M. Fader. 2009. “Climate Change Impacts on Agricultural Yields.” Background note for the World Development Report 2010, World Bank, Washington, DC.
- Nicholls, R. J., N. Marinova, J. A. Lowe, S. Brown, P. Vellinga, D. de Gusmão, J. Hinkel, and R. S. J. Tol. 2011. “Sea-Level Rise and Its Possible Impacts Given a ‘Beyond 4°C World’ in the Twenty-First Century.” Philosophical Transactions of the Royal Society A 369: 161–81.
- Nordhaus, W. D. 1974. “Resources as a Constraint on Growth.” American Economic Review 64 (May): 22–26.
- ———. 2007. “A Review of the Stern Review on the Economics of Climate Change.” Journal of Economic Literature 45 (3): 686–702.
- OECD (Organisation for Economic Co-operation and Development). 2010. Climate Policy and Technological Innovation and Transfer: An Overview of Trends and Recent Empirical Results. Paris: OECD.
- ———. 2011. Towards Green Growth. Paris: OECD.
- ———. 2012. Environmental Outlook to 2050. Paris: OECD.
- Picherta, D., and K. Katsikopoulos, 2008. “Green Defaults: Information Presentation and Pro-Environmental Behaviour” Journal of Environmental Psychology 28: 62–73.
- Porter, M., and C. van der Linde. 1995. “Toward a New Conception of the Environment-Competitiveness Relationship.” Journal of Economic Perspective 9 (4): 97–118.
- Purvis, N., S. Grausz, and A. Light. 2013. Carbon Market Crossroads: New Ideas for Harnessing Global Markets to Confront Climate Change. Washington, DC: Center for American Progress.
- Rodrik, D. 2004. “Industrial Policy for the Twenty-First Century.” CEPR Discussion Paper 4767, Center for Economic Policy Research, Washington, DC.
- Smulders, S., L. Bretschger, and H. Egli. 2011. “Economic Growth and the Diffusion of Clean Technologies: Explaining Environmental Kuznets Curves.” Environmental & Resource Economics 49 (1): 79–99.
- Solow, R. 1986. “On the Intergenerational Allocation of Natural Resources.” Scandinavian Journal of Economics 88 (1): 141–49.
- Steer, A. 1992. “The Environment for Development.” Finance & Development, June.
- Steer, A., and S. Csordis. 2011. “Green Growth in Emerging East Asia?” Paper presented at conference on East Asian Development, Singapore, March 21–22.
- Stern, N. 2006. The Stern Review on the Economics of Climate Change. October 30. Cambridge: Cambridge University Press.
- ———. 2008. The Ely Lecture. American Economic Review Papers and Proceedings.
- ———. 2013. “Economic Growth, Poverty Reduction and Managing Climate Change.” Paper presented at the International Monetary Fund, Washington, DC, April 2. http://www.wri.org/event/2013/04/fostering-growth-and-poverty-reduction-world-immense-risk.
- Sterner, T. 2003. Policy Instruments for Environmental and Natural Resource Management. Washington, DC: Resources for the Future Press.
- Stiglitz, J, A. Sen, and J.-P. Fitoussi. 2009. Report of the Commission on the Measurement of Economic Performance and Social Progress. Paris
- Thaler, R H., and C. R. Sunstein. 2009. Nudge: Improving Decisions about Health, Wealth and Happiness. New York: Penguin.
- Tol, R. 2004 “The Marginal Damage Costs of Greenhouse Gas Emissions: An Assessment of the Uncertainties.” Energy Policy 33: 2064–74.
- ———. 2009. “The Economic Effects of Climate Change.” Journal of Economic Perspectives 23 (2): 29–51.
- UNEP (United Nations Environment Programme). 2008. Green Jobs: Towards Decent Work in a Sustainable, Low-Carbon World. Washington, DC: Worldwatch Institute, for the United Nations Environment Programme.
- ———. 2011a. Decoupling Natural Resource Use and Environmental Impacts from Economic Growth. A Report of the Working Group on Decoupling to the International Resource Panel.
- ———. 2011b. Towards a Green Economy: Pathways to Sustainable Development and Poverty Eradication. A Synthesis for Policy Makers. Geneva. http://www.unep.org/greeneconomy.
- __. 2012. The Emissions Gap Report, 2012. UNEP Synthesis Report, United Nations Environment Programme.
- UN Water, and FAO (Food and Agriculture Organization). 2007. Coping with Water Scarcity: Challenge of the Twenty-First Century. http://www.fao.org/nr/water/docs/escarcity.pdf.
- U.S. EPA (Environmental Protection Agency). 2010. Social Cost of Carbon for Regulatory Impact Analysis under Executive Order 12866. February, Interagency Working Group on Social Cost of Carbon, Washington, DC. www.epa.gov/OTAQ/climate/regulations/scc-tsd.pdf.
- ———. 2011. “The Benefits and Costs of the Clean Air Act from 1990 to 2020.” Washington, DC.
- Weitzman, M. L. 2007. “A Review of the Stern Review on the Economics of Climate Change.” Journal of Economic Literature 45 (3): 703–24.
- ———. 2009. “On Modeling and Interpreting the Economics of Catastrophic Climate Change.” Review of Economics and Statistics 91 (1): 1–19.
- World Bank. 1992. World Development Report 1992: Development and the Environment. Washington DC: World Bank.
- ———. 2008. Framework Document for a Global Food Crisis Response Program. Washington, DC: World Bank.
- ———. 2010. Winds of Change: East Asia’s Sustainable Energy Future. Washington, DC: World Bank.
- ———. 2011a. The Changing Wealth of Nations: Measuring Sustainable Development in the New Millennium. Washington, DC: World Bank.
- ———. 2011b. South Africa: Economic Update; Focus on Green Growth. Washington, DC: World Bank.
- ———. 2012a. Inclusive Green Growth: The Pathway to Sustainable Development. Washington, DC: World Bank.
- ———. 2012b. “Seizing the Opportunity of Green Development in China.” In China 2030. Washington, DC: World Bank.
- WMO (World Meteorological Organization. 2013. Powering Our Future with Weather, Climate and Water. Geneva: WMO.
- WRI (World Resources Institute). 2011. Aqueduct Water Risk Atlas Global Maps 1.0. Washington, DC. http://www.wri.org/aqueduct.
- ———. 2012. Global Coal Risk Assessment: Data Analysis and Market Research. Washington, DC. http://www.wri.org/publication/global-coal-risk-assessment.
- ———. 2013. Aqueduct Global Water Risk Mapping Tool. Washington, DC: World Resources Institute.
- ———. Forthcoming. Food Futures: The 2013–14 World Resources Report. Washington, DC: World Resources Institute.